
Figures & data
Table 1. Fit indices for multigroup measurement models and results of χ2-difference tests.
Table 2. Descriptive statistics and internal consistencies for girls and boys.
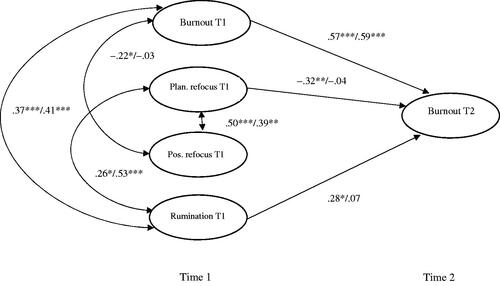
Figure 1. Results of the Multigroup Model. Note. Standardised coefficients (girls/boys) for the relationships between burnout, refocus on planning, positive refocusing, and rumination at Time 1 and burnout at Time 2 are presented. Measured indicators and residual variances, as well as coefficients that did not reach statistical significance (p<.05) either for girls or for boys, were omitted for clarity reasons. ***p ≤ .001; **p ≤ .01; *p < .05.
Supplemental material