Figures & data
Table 1. Sample of relevant research papers on the effect of weather on construction projects.
Table 2. Weather variables and thresholds assumed to cause non-working days.
Figure 1. Locations of weather stations used for the analysis.
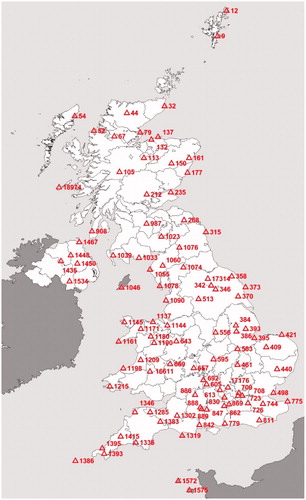
Figure 2. Examples of average daily CRC calculations for all construction activities.
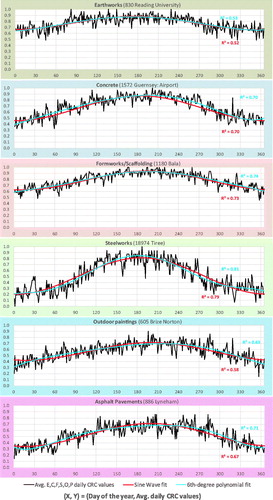
Figure 3. Example maps for vertical shift K (bottom), amplitude A (middle) and phase shift φ (top) for formworks/scaffolding activities in the UK.
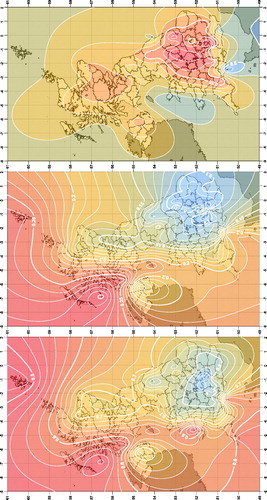
Figure 4. Plots of K, A and φ values with regression expressions assumed.
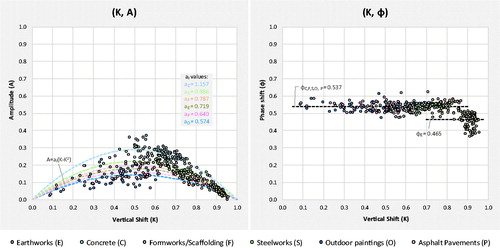
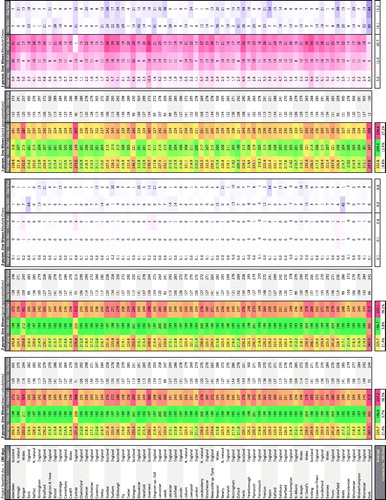
Table 3. Errors in CRC estimates.
Figure 5. Construction schedule for a simplified three-storey reinforced concrete building.
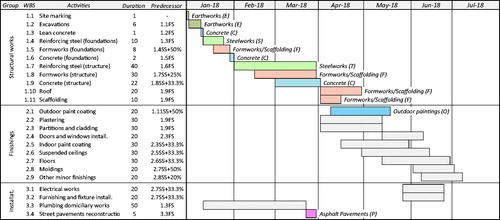
Figure 6. Predicted average, minimum and maximum project durations for the building project by UK city.