
Figures & data
Figure 1. Origin and distribution of analyzed studies over the globe—130 studies (1991–2022)—heat map.
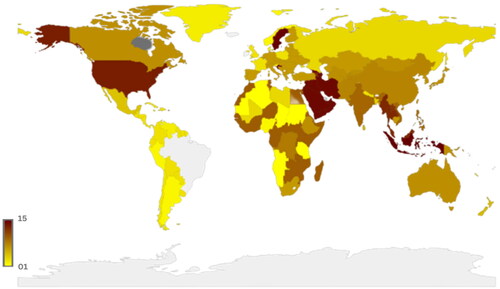
Table 1. Factors affecting construction productivity in different countries worldwide.
Figure 2. The proposed adaptive assessment approach for assessing and ranking factors leading to low construction productivity mitigating subjective biases.
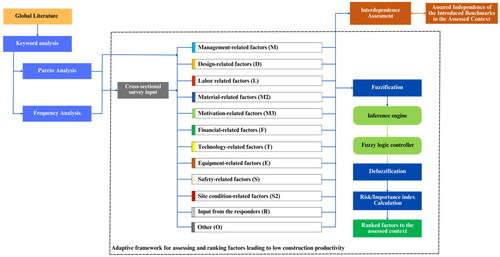
Figure 3. Main research interest clusters using a co-occurrence network of keywords from the selected studies (130 studies).
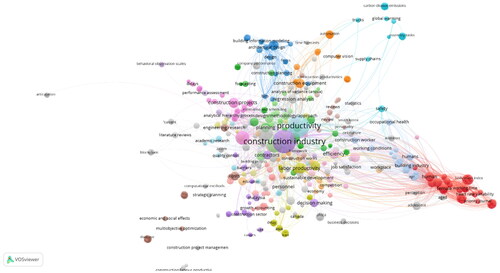
Figure 4. Number of assessed factors in each region with cross-percentage comparison (915 factors, 130 studies) [205 (25)—Number of factors (Number of studies)].
![Figure 4. Number of assessed factors in each region with cross-percentage comparison (915 factors, 130 studies) [205 (25)—Number of factors (Number of studies)].](/cms/asset/17dc4a65-0a86-4a69-bd4b-722375693287/rcme_a_2377712_f0004_c.jpg)
Table 2. Summary of Pareto analysis carried over the introduced regions and benchmarks (number of identified factors—915).
Figure 5. Cross percentage comparison of assessed factors against introduced benchmarks (total—964 with repetition).
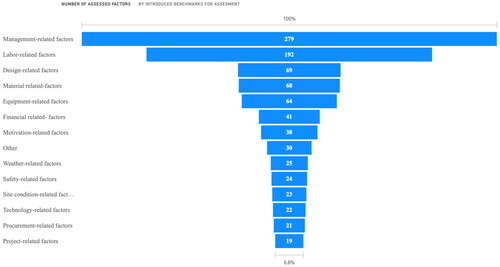
Table 4. Composition of the survey sent to evaluate the criticality and frequency of the identified factors leading to low construction productivity.
Table 3. Composition of the respondents to the survey.
Table 5. Analogy of the criticality and frequency of the employed survey.
Table 6. Assigned numerical values for linguistic variables.
Figure 6. (a) Centroid (criticality assessment)—incompetent management team subfactor, (b) criticality fuzzy set—membership functions utilized in the analysis, (c) frequency fuzzy set—membership functions utilized in the analysis, (d) risk fuzzy set with results for incompetent management team sub factor [Risk Fuzzy value = (0,0,0.5,0.5,0), Crisp value—4.85)].
![Figure 6. (a) Centroid (criticality assessment)—incompetent management team subfactor, (b) criticality fuzzy set—membership functions utilized in the analysis, (c) frequency fuzzy set—membership functions utilized in the analysis, (d) risk fuzzy set with results for incompetent management team sub factor [Risk Fuzzy value = (0,0,0.5,0.5,0), Crisp value—4.85)].](/cms/asset/b9e724b5-4bf9-44b7-bf64-2f8d4118cd6d/rcme_a_2377712_f0006_c.jpg)
Table 7. Inference engine to map with fuzzy risk set.
Table 8. Ranking of the resulting factors through Fuzzy analysis (refer to for ID).
Figure 7. The introduced interdependence assessment approach.
Table 9. Positive results of the interdependence assessment (P—positive, N—negative).
Supplemental Material
Download MS Word (52.2 KB)Supplemental Material
Download MS Word (160.9 KB)Data availability statement
The data supporting this study’s findings are available on request from the corresponding author, [Amila Premakumara].