
Figures & data
Table 1. Components, nutrient and riboflavin concentrations in the feeds (at 90% dry matter)
Figure 1. (a) Daily feed consumption per hen in g (dots are mean values per pen); (b) laying performance per week in % (dots are mean values per pen); (c) individual body weight in kg. Lines represent model estimates for the three supplementation treatments R4.5 (4.5 mg riboflavin kg−1 feed), R3.0 (3.0 mg riboflavin kg−1 feed) and R1.5 (1.5 mg riboflavin kg−1 feed). In b) weekly values above 100 % are explained by variation in time of sampling of eggs between days. n.s.: not significant. The experiment lasted from age weeks 25 to 43 of the hens. Week 1 data were used as correction covariable for the analyses.
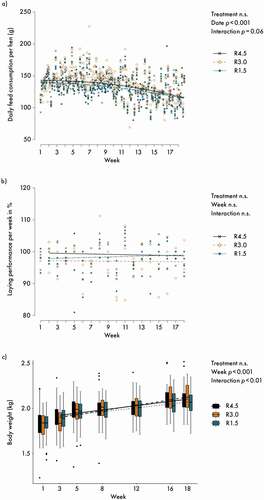
Table 2. Organ weights (model estimates and 95% confidence intervals) with different rates of riboflavin supplementation
Figure 2. (a) Total plumage score; (b) proportion of hens with lesions (lesion score < 8) and (c) proportion of hens with keel bone damage. Lines represent model estimates for the three supplementation treatments R4.5 (4.5 mg riboflavin kg−1 feed), R3.0 (3.0 mg riboflavin kg−1 feed) and R1.5 (1.5 mg riboflavin kg−1 feed). n.s.: not significant. Post-hoc multiple comparisons among treatments for week 18 were never significant. The experiment lasted from age week 25 to 43 of the hens. Week 1 data were used as correction covariable for the analyses.
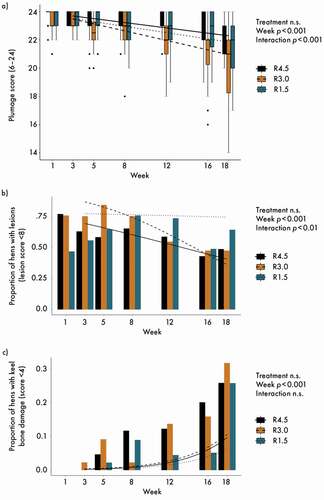
Figure 3. (a) Total egg weight; (b) egg yolk weight; (c) egg shell weight; (d) egg shell strength. n = 60 per treatment and day. Lines represent model estimates for the three supplementation treatments R4.5 (4.5 mg riboflavin kg−1 feed) R3.0 (3.0 mg riboflavin kg−1 feed) and R1.5 (1.5 mg riboflavin kg−1 feed). n.s.: not significant. Post-hoc multiple comparisons among treatments for week 18 were never significant. The experiment lasted from age week 25 to 43 of the hens. Week 1 data were used as correction covariable for the analyses.
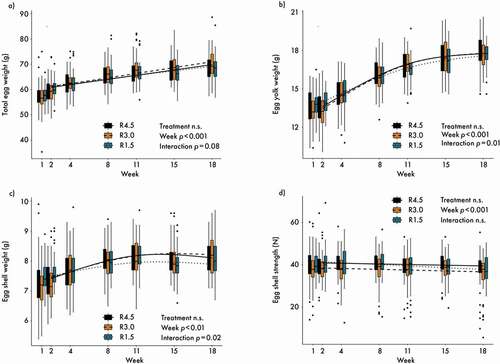
Figure 4. Yolk colour: (a) L* values (brightness); (b) a* values (red-green axis) (c) b* values (yellow-blue axis). n = 60 per treatment and day. Lines represent model estimates for the three supplementation treatments R4.5 (4.5 mg riboflavin kg−1 feed) R3.0 (3.0 mg riboflavin kg−1 feed) and R1.5 (1.5 mg riboflavin kg−1 feed). n.s.: not significant. The experiment lasted from age week 25 to 43 of the hens. Week 1 data were used as covariable for the analyses.
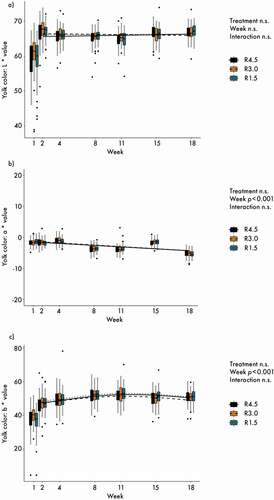
Table 3. Riboflavin concentration (model estimates and 95% confidence intervals) in mg 100 g−1 egg yolk (week 7 and 18, n = 3) and liver (week 11 and 18, n = 3) with different rates of riboflavin supplementation