
Figures & data
Table 1. Overview of design activities in the action design research project.
Figure 1. Left: Paper prototype used in design activities on mapping user details (session 1 and 3). Centre: Paper prototype sketch on visualising progress (‘road’) in the artifact (session 1 and 3). Right: Test of games in gamification workshop (session 5).
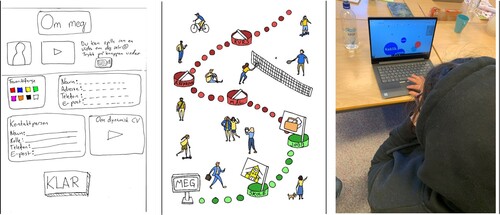
Figure 2. Left: Version of mapping skills and abilities (Smiley faces combined with colours to grade personal skills and abilities). Centre: Version of mapping abilities and preferences (User chooses what he/she dislikes or prefers, the bar below visualises task progress). Left: Version of mapping interest (User chooses which interests he/she has).
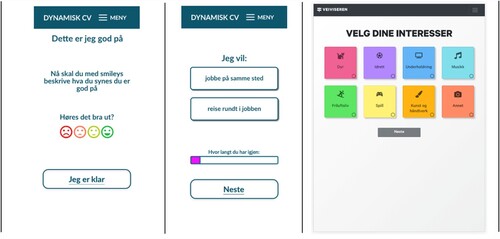
Table 2. Overview of participants in the first participant group.
Table 3. Overview of participants in the second participant group.
Table 4. Overview of support staff.
Table 5. Examples of a thematic analysis.