
Figures & data
Figure 1. Major categories of interventions under the experience-driven framework.
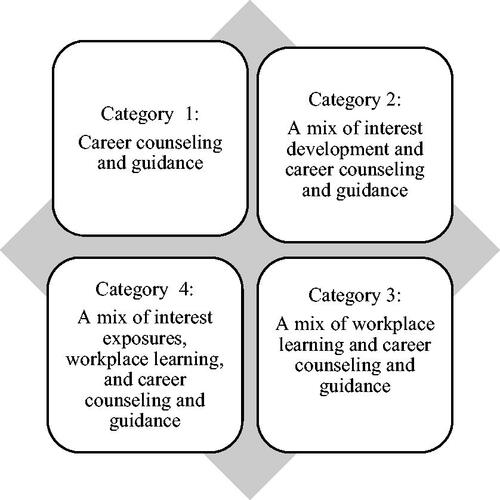
Table 1. Socio-demographic characteristics of participants.
Table 2. Pre-intervention comparison of NEET participants in psychosocial resources with regard to their gender, educational attainment, length of duration as NEETs, and presenting problems (n = 660).
Table 3. Repeated measures ANOVA of psychosocial resources by controlling for gender, educational attainment, length of duration as NEETs, and presenting problems. (n = 660).
Table 4. MANCOVA and Underlying Univariate ANCOVAs of post-intervention scores on career adaptability, social support, and career engagement by groups of interventions (n = 660).
Univariate ANCOVAs
Table 5. Pre- and post-intervention status and sources of recognition.
Access to data
The data that support the findings of this study are available from the corresponding author upon reasonable request.