Figures & data
Figure 1. Fungal interaction with rock phosphate (RP) particles on MEA plates. Images show RP incubated with (a) no fungal inoculant, (b) Aspergillus niger, (c) Trametes versicolor, and (d) Serpula himantioides for 7 days at 25 °C in the dark, with examples of mineral precipitation or dissolution circled. Scale bars: 1 mm. Images shown are typical of several images.
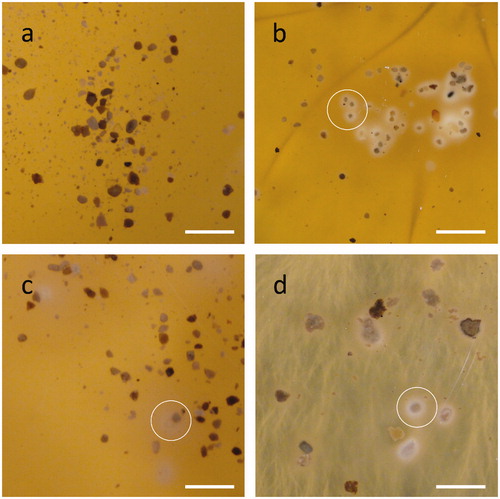
Figure 2. Alterations of rock phosphate (RP) surface structure caused by fungi. SEM images of RP incubated with (a, b) no fungi, (c, d) Aspergillus niger, (e, f) Trametes versicolor, (g, h) Serpula himantioides on MEA until fungal colonies had reached the edge of the Petri dishes. Higher magnification images in the right panel all relate to the respective panel on the left. Scale bars: (a) 100 µm, (b, d, h) 20 µm, (c, g) 200 µm, (e) 50 µm, (f) 5 µm. Images shown are typical of several images.
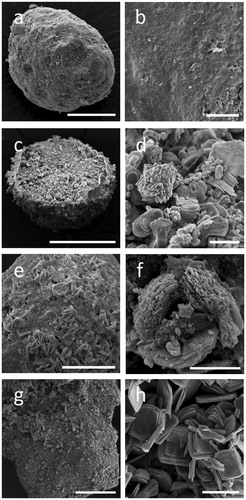
Figure 3. X-ray diffraction patterns of (a) untreated rock phosphate (RP) and RP incubated with (b) Aspergillus niger or with (c) oxalic, (d) gluconic or (e) citric acid at 0.5 mol/l. Standard patterns of (f) whewellite (ICSD 434201) and (g) fluorapatite (ICSD 9444) are also shown. All replicate samples from within treatments were pooled, and a subsample analyzed. Note the formation of whewellite when RP was incubated with A. niger and oxalic acid. Typical patterns are shown from one of several analyses.
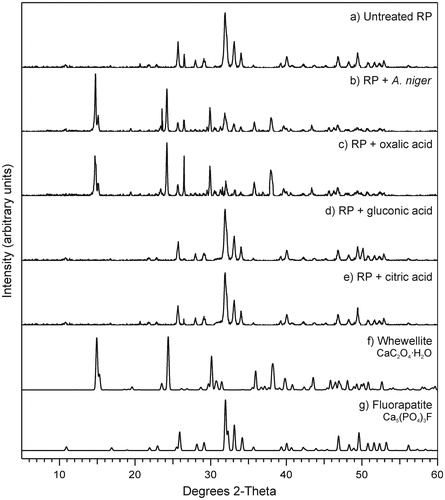
Table 1. Growth rates (mm/day ± standard error of mean) of test fungi on MEA plates with (+) or without (−) rock phosphate at 0.5% (w/v).
Figure 4. Solubilization haloes from (a–d) Ca3(PO4)2 or (e–h) rock phosphate by addition of individual organic acids into wells bored in MEA plates amended with 0.5% P mineral. Agar wells were filled with 20 µl (a, e) ultrapure water, (b, f) citric, (c, g) oxalic or (d, h) gluconic acid. All organic acid concentrations were 0.5 mol/l. Images shown are typical examples from several determinations.
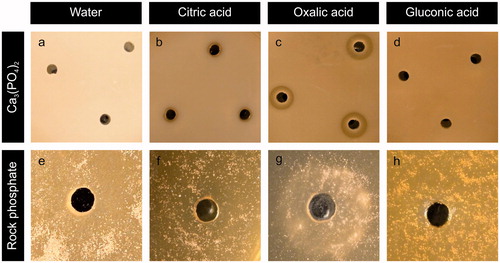
Figure 5. Alterations of RP surface structure when treated with organic acids in abiotic agar plates. SEM images showing RP exposed to (a, b) ultrapure water, (c, d) citric, (e, f) oxalic, or (g, h) gluconic acid. Scale bars: (a) 50 µm, (c, e, g) 100 µm, (b) 10 µm, (d, h) 25 µm, (f) 5 µm. Images shown are typical of several images.
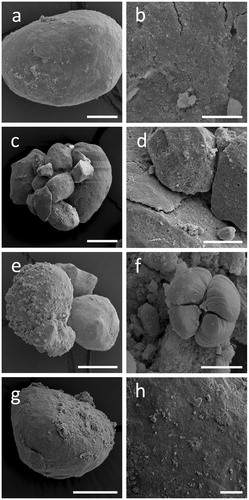
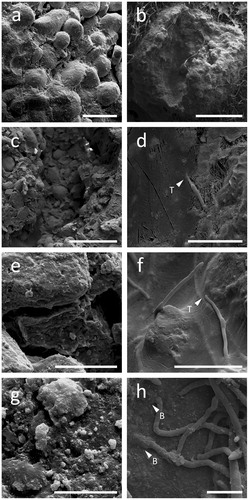
Figure 6. Colonization of RP particles by Aspergillus niger. Left (a, c, e, g) and right (b, d, f, h) panels show cryogenic scanning electron micrographs of non-inoculated and inoculated RP particles, respectively. Note the complex aggregate structure (a, c) and the porosity (e, g) of RP particles. The images on the right show a RP particle with the middle section removed, allowing the interior of the particle to be studied. Note the ability of A. niger to effectively colonize RP particles (b), as well as thigmotropically (T) responding to cracks and fissures within the structure (d, f), physically burrowing (B) through RP particles (h) and depositing minerals or forming mineral nucleation sites on their hyphal surfaces (h). Scale bars: (a) 200 µm, (b) 1 mm, (c) 500 µm, (d–f) 50 µm, (g) 10 µm, and (h) 20 µm.