
Figures & data
Table 1. Question about teachers’ barriers in using OER
Table 2. Items for the distal outcomes and their question types
Figure 1. LCA with distal outcome. L1–L5 represent the items that measure the local barrier. M1–M5 represent the items that measure the macro barrier. P1–P5 represent the items that measure the personal barrier. D1–D8 represent the distal outcome items
Table 3. Model selection indices for nine latent class models
Figure 2. Mean scores of each barrier category for different latent classes
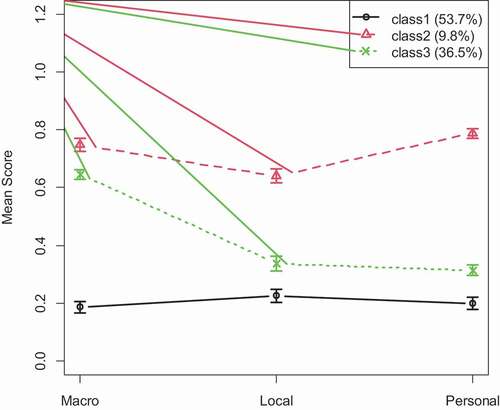
Figure 3. Sample person-centered diagnosis report for Respondent 217
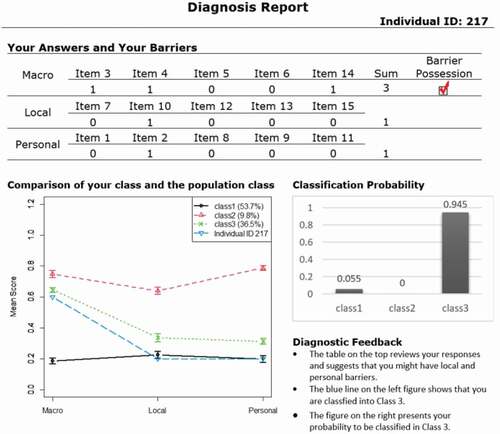
Table 4. Estimated mean for each distal outcome items across the three classes
Data availability statement
The data that support the findings of this study are openly available on figshare at https://doi.org/10.6084/m9.figshare.1317313.v1, reference number 1317313.