Figures & data
Figure A1. Optimality gap of the models vs. time granularity, split by objective.
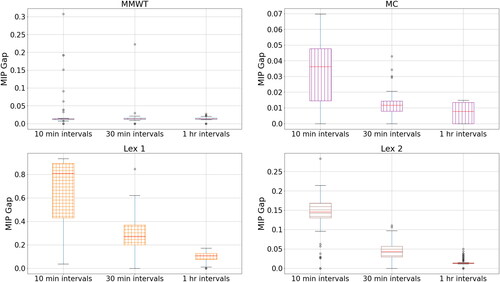
Figure A2. Boxplot of changes for the different objectives with MMWT and Lex 1 removed, for easier comparison.
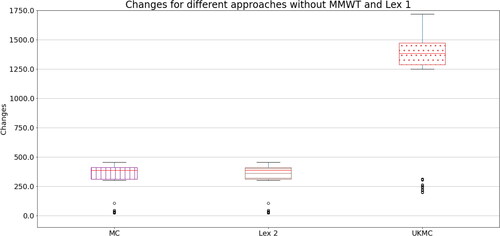
Figure A3. Increase in max workers by allowable increase in changes.
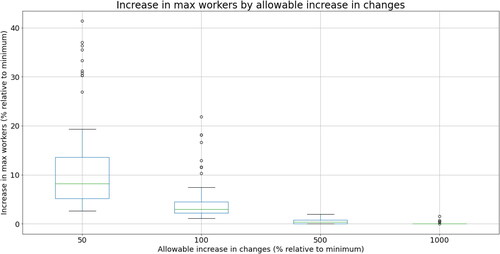
Figure A4. Increase in changes by allowable increase in max workers.
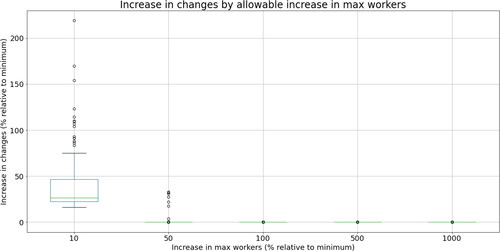
Figure 1. Diagram of a small example mail centre (Mech.: mechanically sorted; Man.: manually sorted).
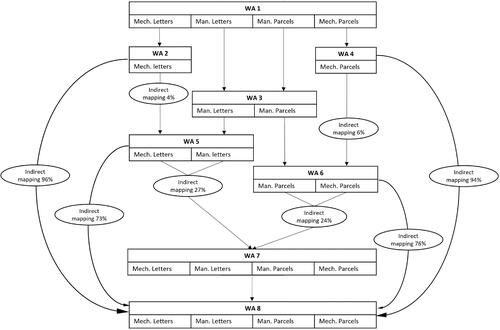
Figure 2. Base network of a small example of a mail centre.
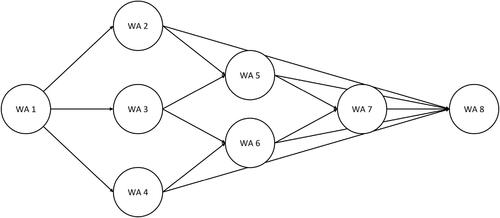
Figure 3. Time-expanded version of the base network from for eight time periods.
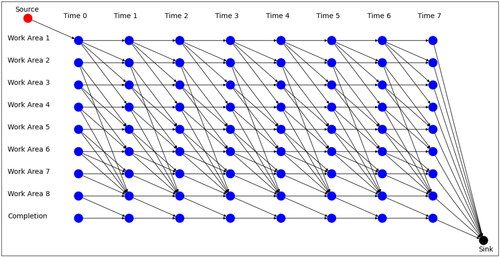
Figure 4. Boxplots of maximum workers for each day for the different approaches, as well as those recommended by the UKMC.
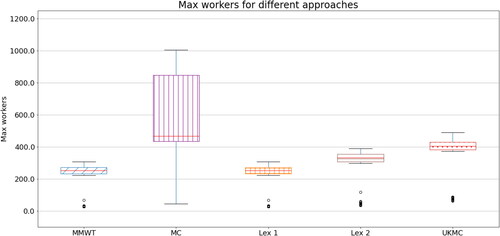
Figure 5. Boxplots of changes required for each day for the different approaches, as well as those recommended by the UKMC.
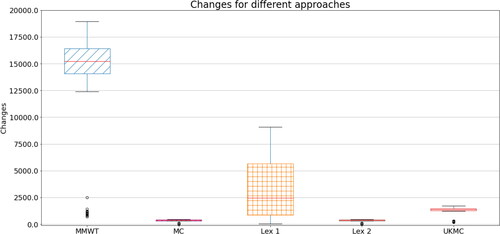
Figure 6. Max workers vs. mail volume increase for different approaches.
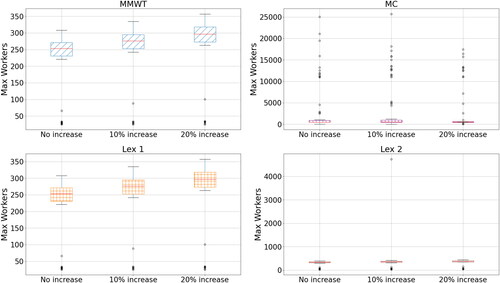
Figure 7. Changes vs. mail volume increase for the different approaches.
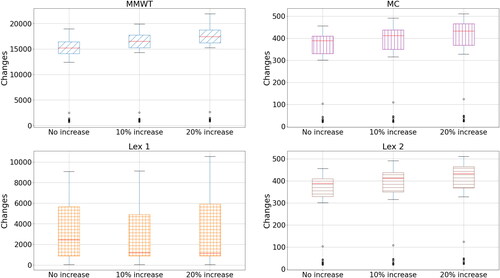
Figure 8. Max workers vs. proportion of letters. Eighty percent letters is the current baseline.
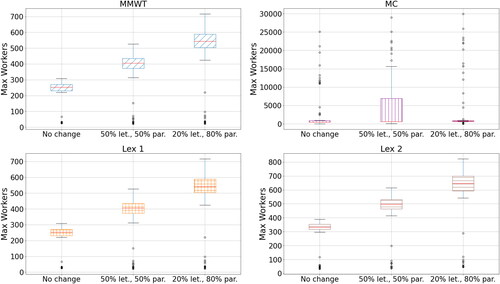
Figure 9. Changes vs. proportion of letters. Eighty percent letters is the current baseline.
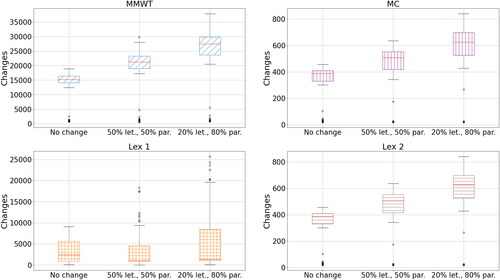
Figure 10. Max workers vs. different levels of time discretisation, split by approach.
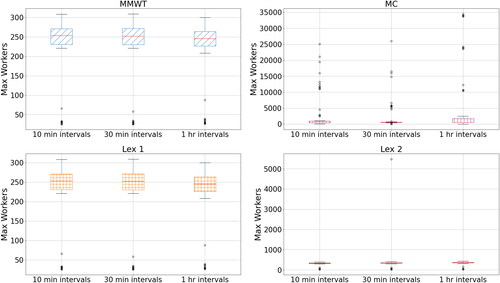
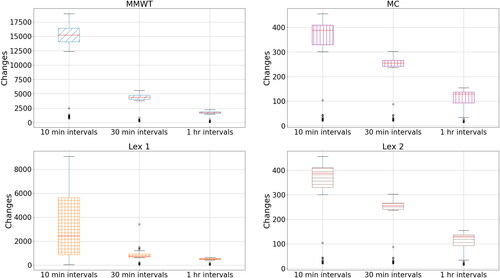
Figure 11. Changes vs. different levels of time discretisation, split by approach.