
Figures & data
Table 1. Demographic data, n = 4.
Table 2. Activity categories and definitions.
Table 3. Percentage of places and activities in the time-geography chart.
Figure 1. The X-axis represents the places nurses most commonly occupied during the observed hours. The Y-axis represents the hours of the working day. The dots at each hour represents the most common activity during that time and one hour on. The green vertical line indicates the day shift, while the purple vertical line indicates the evening shift.
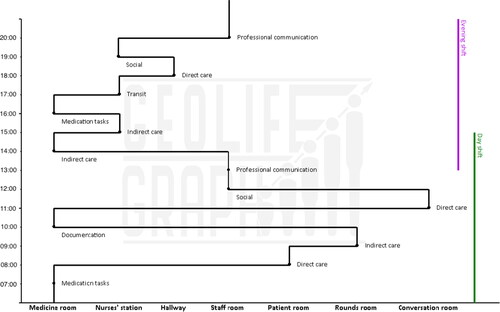
Table 4. Overview of activity-time distribution.
Table 5. Overview of places and activity distributions.
Data availability statement
Data is available upon reasonable request. This research adhered to the STROBE reporting checklist (von Elm et al., Citation2008).