
Figures & data
Table 1. Example instruments items concerning prejudice.
Table 2. Demographic characteristics.
Table 3. Two-way mixed ANOVAs for prejudice toward people living with general mental illness, depression, or schizophrenia: Total scores.
Table 4. Summary of subscale results.
Figure 1. Interaction of group and time for prejudice toward people living with mental illness.
Note: N = 126. Figure zoomed in to show trend.
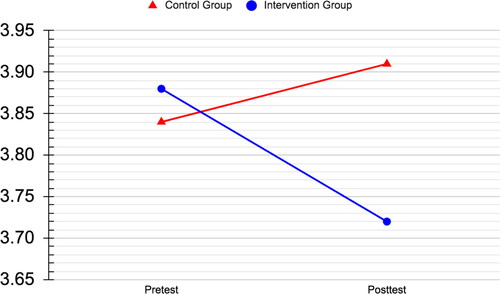
Figure 2. Interaction of group and time for prejudice toward people living with depression.
Note: N = 126. Figure zoomed in to show trend.
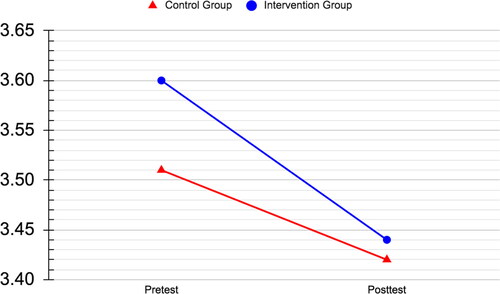
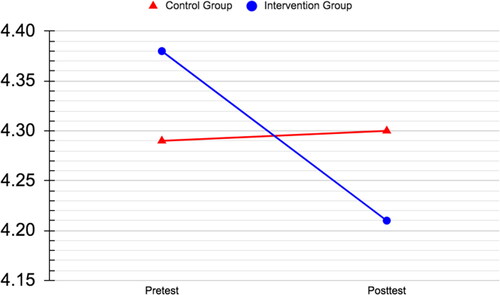
Figure 3. Interaction of group and time for prejudice toward people living with schizophrenia.
Note: N = 126. Figure zoomed in to show trend.
Supplemental material