
Figures & data
Figure 1. Flowchart of the patient inclusion process.
Figure 2. Cumulative occurrence of recurrent stroke according to the presence of ICAS and ESRS using Kaplan – Meier survival analysis within 3 months. A: cumulative risk of recurrence at 3 months with or without ICAS in the low-risk group according to ESRS. B: cumulative risk of recurrence at 3 months with or without ICAS in the high-risk group according to ESRS. C: cumulative risk of recurrence at 3 months categorized by ICAS and ESRS (a: low-risk with ICAS; b: high-risk with ICAS; c: low-risk without ICAS; d: high-risk without ICAS).
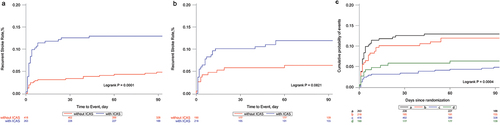
Figure 3. Multivariate analysis of predictors for 3-month stroke recurrence based on the ESRS stratification.
Table 1. Baseline characteristics in patients stratified by ESRS based on 3-month recurrence.
Table 2. Baseline characteristics in patients stratified by ESRS based on 12–month recurrence.
Supplemental Material
Download Zip (3.5 MB)Data availability statement
The datasets analyzed during the current study are available from the corresponding author upon reasonable request.