
Figures & data
Figure 1. Flowchart from inclusion of the VIP and MONICA subjects to final cancer case groups.
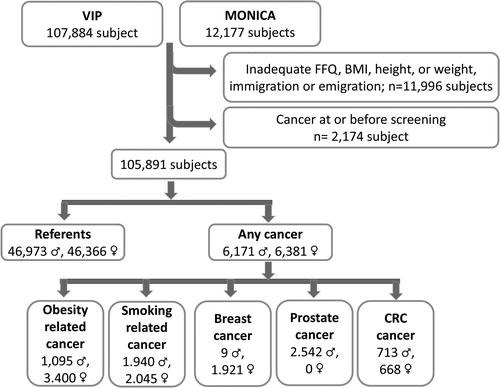
Table 1. Baseline characteristics of the study subjects.
Figure 2. A: Distribution, and mean daily intake, of the four dairy product categories among total dairy intake in the study population. B: Sex standardized mean daily intake in the four dairy product categories by quintile categories.
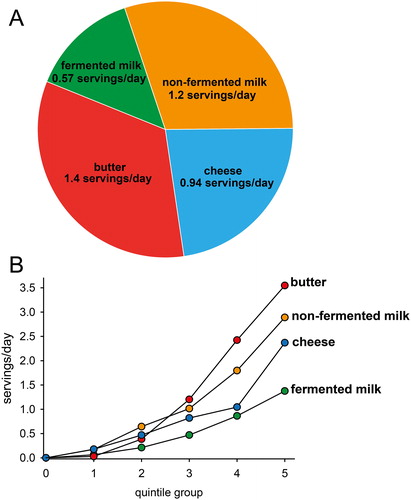
Table 2. Hazard ratios (95% CIs) for intakes of dairy products and cancer of any type calculated from abasic and badjusted Cox proportional hazard models.
Table 3. Hazard ratios (95% CIs) for intakes of dairy products and obesity-related cancer calculated from abasic and badjusted Cox proportional hazard models.
Table 4. Hazard ratios (95% CIs) for intakes of dairy products and smoking-related cancer calculated from abasic and badjusted Cox proportional hazard models.
Table 5. Hazard ratios (95% CIs) for intakes of dairy products and prostate cancer in men and breast cancer in women calculated from abasic and badjusted Cox proportional hazard models.
Table 6. Hazard ratios (95% CIs) for intakes of dairy products and colorectal cancer calculated from abasic and badjusted Cox proportional hazard models.