Figures & data
Figure 1. Localization of Drosophila and human Htt N-terminal fragments with transport cargo. (A) GFP-tagged cargos were expressed with C380-GAL4 with either an N-terminal 665 amino acid fragment of dHtt (left panel), or an N-terminal 588 amino acid fragment of normal (Q15, middle panel) or pathogenic (Q138, right panel) human Htt. Each of the 12 image squares depicts three image channels of the same axon: top channel = Htt-RFP; middle channel = GFP-cargo, bottom = merged. Scale bar =10 μm. (B) Calculation of RFP and GFP fluorescence intensity overlap using Pearson’s coefficient (R value) calculated with Volocity software. *denotes p < 0.05.
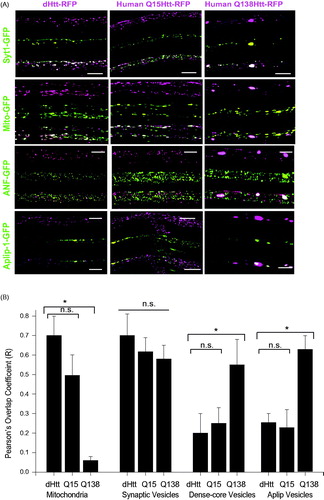
Figure 2. Abnormal flux of mitochondria in dhtt−/− mutants. (A) Kymographs of mitochondrial movement in motor axons. (B) Quantification of retrograde: anterograde flux. Drosophila full-length (FL) Htt and an N-terminal mRFP tagged Drosophila dHtt construct rescued the increased flux in dhtt−/−. Human (Hu) Htt Q16 also rescued the transport defect, while human HttQ138 did not. All rescue constructs were assayed in the dhtt−/− null background. The Drosophila full-length (FL) Htt construct was driven with the endogenous dhtt promoter and all others were driven with C380-GAL4. Error bars represent SEM, *indicates p < 0.05 ANOVA. n.s.: no significant difference.
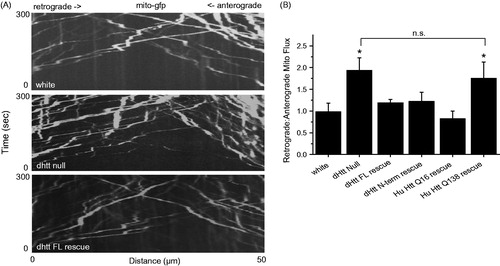
Figure 3. FAT defects for mitochondria in dhtt−/− mutants. Run data was collected from individual mitochondria tracked in each one-second frame of a 300 image confocal time series. Tracks were used to calculate run distance, duration, and velocity for control white larvae, dhtt−/−, and dhtt−/− expressing a dhtt full-length rescue construct. Anterograde or retrograde designations reflect the imprinted or primary direction of movement. (A) dhtt−/− larvae exhibit a decrease in run distance for both anterograde and retrograde moving mitochondria. (B) dhtt−/− larvae exhibit a decrease in run duration for both anterograde and retrograde moving mitochondria. (C) dhtt−/− larvae exhibit an increase in velocity for retrograde moving mitochondria. Error bars represent SEM, *indicates p < 0.05.
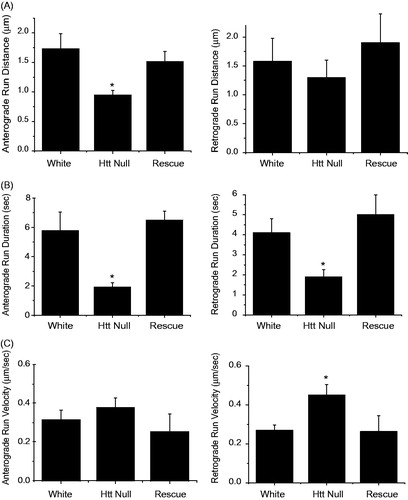
Table 1. Summary of transport kinetics for live tracking of synaptic vesicles (Syt-1-GFP) and dense-core vesicles (ANF-GFP) expressed with the CCAP-GAL4 driver.
Figure 4. Track analysis for anterograde and retrograde moving mitochondria in control white larvae, dhtt−/−, and dhtt−/− expressing a dhtt full-length rescue construct. Tracks represent three states of mitochondrial movement for an individual mitochondrion tracked over the entire track length, including movement in the primary direction, reverse direction, and stops. Anterograde or retrograde designations reflect the imprinted or primary direction of movement. (A) Loss of dHtt results in an increase in mitochondrial stops, indicating a defect in processivity. (B) Loss of dHtt results in an increase in mitochondrial run reversals, indicating a defect in motor coordination. N > 10 larvae per genotype and n > 12 mitochondria per larvae for all panels. Error bars represent SEM, *indicates p < 0.05.
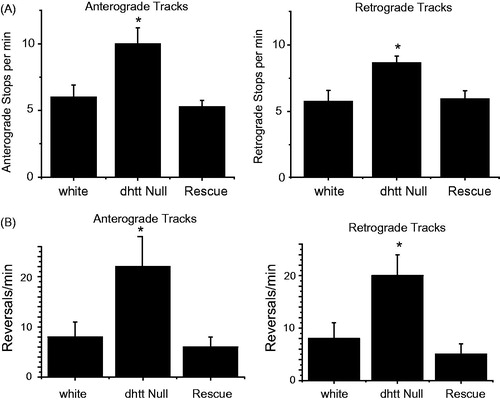
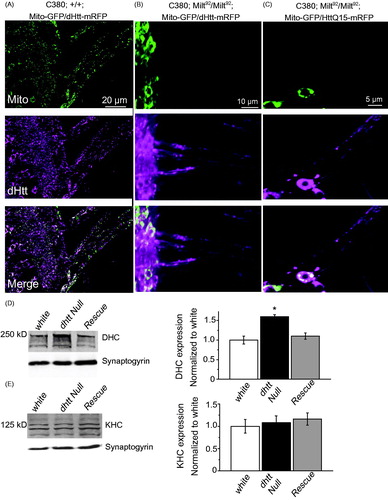
Figure 5. Mitochondria and HAP1 are not required for Htt axonal localization. (A) Expression of Mito-GFP and dHtt-mRFP in motor neurons in a control stage 17 embryonic ventral nerve cord shows distribution of mitochondria and Htt throughout the cell body and from axons exiting the CNS. (B) Without HAP1 in a milt92 mutant background, mitochondria are trapped within the cell body, while dHtt-mRFP is still present in axons. (C) Human HttQ15-mRFP also localizes to axons in the absence of HAP1. (D) Dynein heavy chain levels are increased in dhtt−/− adults. Adult head extracts from ten 20-day old flies were assayed by Western blot and probed for dynein heavy chain (DHC) and Synaptogyrin (loading control). Quantification of DHC levels from five separate measurements normalized to control white animals is shown in the right panel. (E) The levels of kinesin heavy chain (KHC) were not changed in dhtt−/− aged adults. Quantification of KHC levels from five separate measurements normalized to control white animals is shown on the right.