Figures & data
Figure 1. Cloning of forpr-Gal4s. (A) Schematic of the foraging locus (dark grey – exons), its transcripts above the locus (grey – UTR, black – ORF), transcription start sites (arrows) and the cloned regions (colored bars below locus) used in the promoter analysis. The regions up to 5 kb upstream of and 300 bp downstream of the TSS for the four identified minimal promoters were cloned into a gypsy insulated Gal4 vector. The ORF used in the UAS-forcDNA is annotated below the transcripts and is a derivative of the RNA transcript A (RA) and codes for the protein isoform A (PA). (B) Example of one of the cloned forpr1-Gal4 constructs. The forpr1-Gal4 segment is flanked by gypsy insulator sequences. An attB site-specific recombination sequence from φC31 was added to the vector. (C) PCR confirmation of the four forpr-Gal4 integrations. There was a positive integration event in all lines.
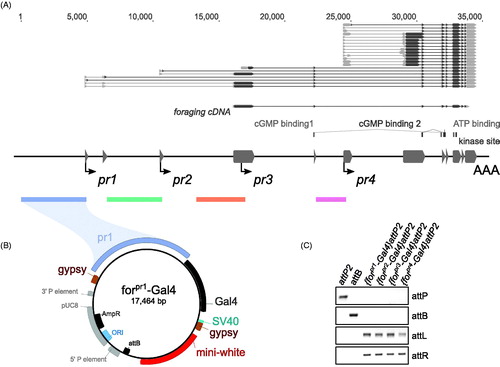
Figure 2. forpr-Gal4s expression in the 3rd instar larval CNS, gastric system, and fat body. Whole-mount immunofluorescence analysis of forpr-Gal4 driving UAS-mCD8::GFP in the larval CNS and stained with anti-GFP. Sample sizes were n ≥ 12 larvae for each of experiment. Representative images are shown. Scale bars = 100 µm. (A) Schematic of the foraging locus with the cloned regions near the transcription start sites highlighted. (B) forpr1-Gal4 expressed in neurons throughout the VNC and brain lobes. (C) forpr2-Gal4 expressed in midline glia in the VNC. (D) forpr3-Gal4 expressed in the perineurial surface glia of the CNS and PNS. (E) forpr4-Gal4 expressed in the optic lobes of the CNS and the eye imaginal discs and the leg imaginal discs. (F) forpr1-Gal4 expressed in enteroendocrine cells in the anterior portion of the larval midgut. (G) forpr2-Gal4 expressed in the adult midgut precursor cells (AMP) throughout the midgut. (H) forpr3-Gal4 expressed in the muscle of the midgut. (I) forpr4-Gal4 expressed in the h5d, h6d, hv, and h7 regions of the larval hindgut. (J) forpr1-Gal4 was not expressed in fat body. (K) forpr2-Gal4 was not expressed in fat body. (L) forpr3-Gal4 was expressed in the fat body. (M) forpr4-Gal4 was not expressed in fat body.
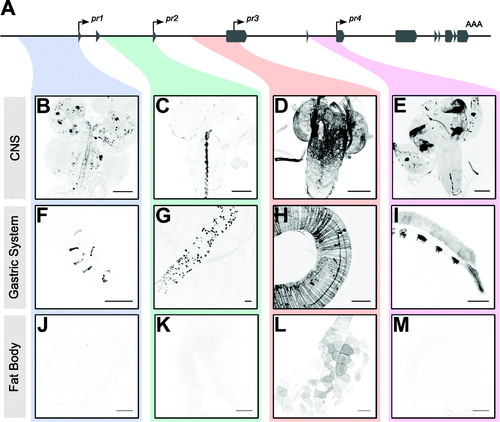
Figure 3. forp1-Gal4 rescues foraging null (for0) larval path length. (A) The pr1 experimental (for0/for0; {forpr1-Gal4}/{UAS-forcDNA}) had significantly longer path lengths than either the Gal4 control (for0/for0; {forpr1-Gal4}/+, p = .00041) and the UAS control (for0/for0; +/{UAS-forcDNA}, p = .0004). (B) The pr2 experimental (for0/for0; {forpr2-Gal4}/{UAS-forcDNA}) did not have significantly longer path lengths than the Gal4 control (for0/for0; {forpr2-Gal4}/+, p = .95). (C) The pr3 experimental (for0/for0; {forpr3-Gal4}/{UAS-forcDNA}) was not significantly different from the Gal4 control (for0/for0; {forpr3-Gal4}/+, p = .93) or the UAS control (for0/for0; +/{UAS-forcDNA}, p = .89). (D) The pr4 experimental (for0/for0; {forpr4-Gal4}/{UAS-forcDNA}) was not significantly different from the UAS control (for0/for0; +/{UAS-forcDNA}, p = .17). Sample size: n = 30 larvae per genotype per plot. The boxplots show the mean with the whiskers displaying 1.5 times the interquartile range. For a rescue to be considered significant the UAS/Gal4 treatment had to be significantly different than both of the UAS and the Gal4 controls.
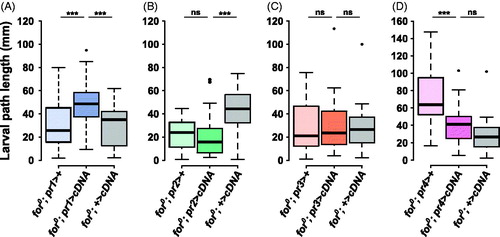
Figure 4. forp3-Gal4 affects larval triglyceride levels. (A) The pr1 experimental (for0/for0; {forpr1-Gal4}/{UAS-forcDNA}) was not significantly different from the Gal4 control (for0/for0; {forpr1-Gal4}/+, p = .78) or the UAS control (for0/for0; +/{UAS-forcDNA}, p = 0.94). (B) The pr2 experimental (for0/for0; {forpr2-Gal4}/{UAS-forcDNA}) was intermediate between the significantly different Gal4 (for0/for0; {forpr2-Gal4}/+) and UAS (for0/for0; +/{UAS-forcDNA}) controls. (C) There was significant variation in the pr3 triglyceride experiment (F(2,27) = 3.76, p = .036). The pr3 experimental (for0/for0; {forpr3-Gal4}/{UAS-forcDNA}) bordered on being significantly different from the Gal4 control (for0/for0; {forpr3-Gal4}/+, p = .06) and the UAS control (for0/for0; +/{UAS-forcDNA}, p = .06). D) The pr4 experimental (for0/for0; {forpr4-Gal4}/{UAS-forcDNA}) was not significantly different from the Gal4 control (for0/for0; {forpr4-Gal4}/+, p = 1.00). Sample size: n = 10 extracts (of 10 pooled larvae) per genotype per plot. The boxplots show the mean with the whiskers displaying 1.5 times the interquartile range. For a rescue to be considered significant the UAS/Gal4 treatment had to be significantly different than both of the UAS and the Gal4 controls.
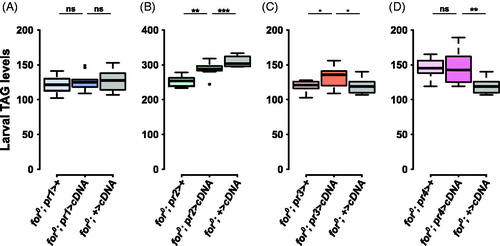
Figure 5. forp4-Gal4 rescues null larval food intake. (A) The pr1 experimental (for0/for0; {forpr1-Gal4}/{UAS-forcDNA}) was not significantly different from the UAS control (for0/for0; +/{UAS-forcDNA}, p = .85). (B) The pr2 experimental (for0/for0; {forpr2-Gal4}/{UAS-forcDNA}) was not significantly different from the Gal4 control (for0/for0; {forpr2-Gal4}/+, p = .87) or the UAS control (for0/for0; +/{UAS-forcDNA}, p = .86). (C) The pr3 experimental (for0/for0; {forpr3-Gal4}/{UAS-forcDNA}) was not significantly different from the Gal4 control (for0/for0; {forpr3-Gal4}/+, p = .18). (D) The pr4 experimental (for0/for0; {forpr4-Gal4}/{UAS-forcDNA}) was significantly different from the Gal4 control (for0/for0; {forpr4-Gal4}/+, p = .00005) and the UAS control (for0/for0; +/{UAS-forcDNA}, p = .006). Sample size: n = 10 extracts (of 10 pooled larvae) per genotype per plot. The boxplots show the mean with the whiskers displaying 1.5 times the interquartile range. For a rescue to be considered significant the UAS/Gal4 treatment had to be significantly different than both of the UAS and the Gal4 controls.
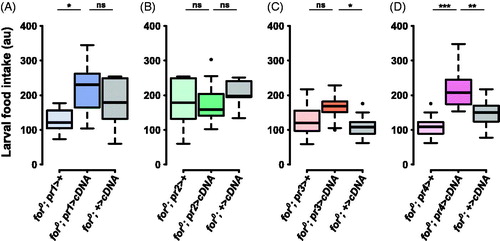
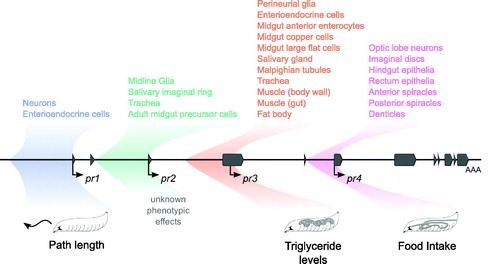
Figure 6. Summary of expression and phenotypic effects. A schematic of the foraging gene in the center with exons in grey and transcription start sites marked with arrows. The regions cloned in the forpr-Gal4s are colored and shaded. The expression patterns seen in the forpr-Gal4s are summarized above the locus. Depictions of the rescued phenotypes are shown below the locus.