Figures & data
Table 1. Mean total shoot dry weight, total root dry weight, total dry weight, total plant carbon, and total plant nitrogen for each treatment with standard errors and ANOVAs.
Figure 1. A) Total root length and B) root surface area in soybean plants inoculated with Pseudomonas sp. ATCC PTA-122608, not inoculated, or inoculated with a substrate control, partitioned by root diameter class. C) Specific root length in each treatment. Letters indicate significant differences between treatments at the p = 0.05 level. Letters in A) and B) represent comparisons between treatments for each diameter class as well as total root length and surface area. Error bars indicate standard error.
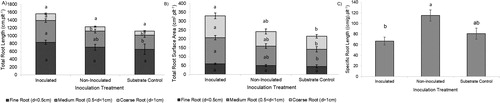
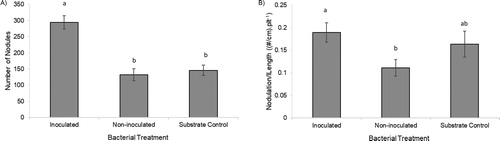
Figure 2. A) Total nodulation and B) nodulation/length of soybean plant roots inoculated with Pseudomonas sp. ATCC PTA-122608, not inoculated with the bacteria, and inoculated with the substrate control. The letters represent significant differences between treatments at the p = 0.05 level. Error bars indicate standard error.