
Figures & data
Table 1. Agrochemical properties of soil used in both experiments.
Table 2. Experimental treatments of waste sulfur in combination with another nutrients.
Figure 1. The average daily temperature (°C) and relative humidity (%) in the vegetation hall during the experiment.
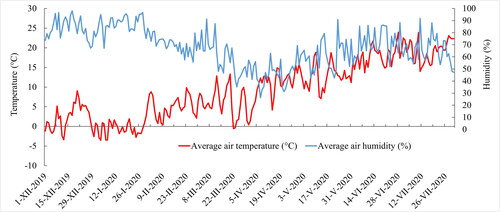
Table 3. The average content of N and S in the plants and their uptake by AGB of 1 plant with the N:S ratio.
Figure 2. The average N-tester values (BBCH 19, October 24, 2019). Columns marked by different letters indicate significant differences p < 0.05 (fisher’s LSD test). The error bars present the mean standard deviation. 1. unfertilized control (control), 2. waste elemental sulfur (S), 3. S + boron (B), 4. S + B + humic substances (HS), 5. S + B + HS + ammonium sulfate (AS), 6. S + B + HS + ammonium nitrate (AN).
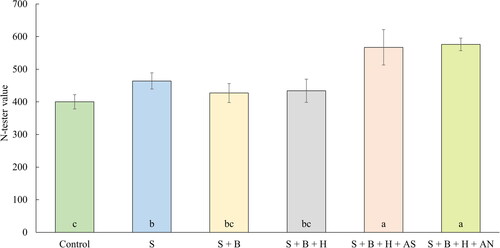
Figure 3. The average DM weight of AGB (g 1 plant−1; BBCH 19, October 24, 2019). Columns marked by different letters indicate significant differences p < 0.05 (fisher’s LSD test). The error bars present the mean standard deviation. 1. unfertilized control (control), 2. waste elemental sulfur (S), 3. S + boron (B), 4. S + B + humic substances (HS), 5. S + B + HS + ammonium sulfate (AS), 6. S + B + HS + ammonium nitrate (AN).
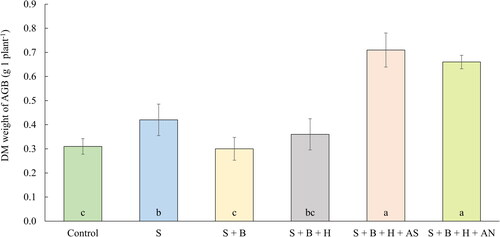
Table 4. Average content of nutrients in plants at the start of bud formation (April 14, 2020).
Figure 4. The average straw yield of oilseed rape (g pot−1) (July 14, 2020). Columns marked by different letters indicate significant differences p < 0.05 (fisher’s LSD test). The error bars present the mean standard deviation. 1. unfertilized control (control), 2. waste elemental sulfur (S), 3. S + boron (B), 4. S + B + humic substances (HS), 5. S + B + HS + ammonium sulfate (AS), 6. S + B + HS + ammonium nitrate (AN).
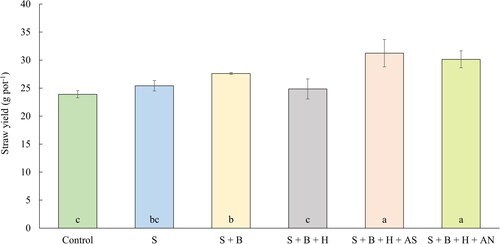
Figure 5. The average seed yield of oilseed rape (g pot−1) (July 14, 2020). Columns marked by different letters indicate significant differences p < 0.05 (fisher’s LSD test). The error bars present the mean standard deviation. 1. unfertilized control (control), 2. waste elemental sulfur (S), 3. S + boron (B), 4. S + B + humic substances (HS), 5. S + B + HS + ammonium sulfate (AS), 6. S + B + HS + ammonium nitrate (AN).
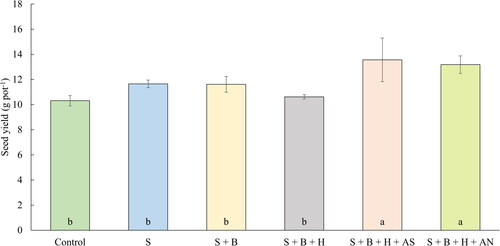
Table 5. Average post-harvest content of nutrients in straw of rape.
Figure 6. The average oil content of oilseed rape (July 14, 2020). Columns marked by different letters indicate significant differences p < 0.05 (fisher’s LSD test). The error bars present the mean standard deviation. 1. unfertilized control (control), 2. waste elemental sulfur (S), 3. S + boron (B), 4. S + B + humic substances (H), 5. S + B + HS + ammonium sulfate (AS), 6. S + B + HS + ammonium nitrate (AN).
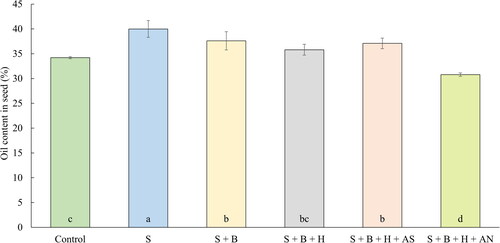
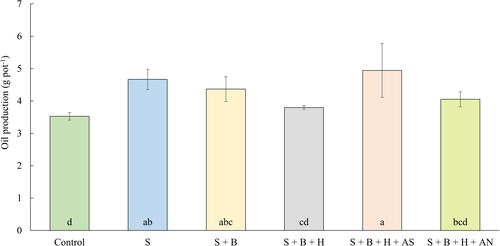
Figure 7. The average production of oil (g pot−1) (July 14, 2020). Columns marked by different letters indicate significant differences p < 0.05 (fisher’s LSD test). The error bars present the mean standard deviation. 1. unfertilized control (control), 2. waste elemental sulfur (S), 3. S + boron (B), 4. S + B + humic substances (HS), 5. S + B + HS + ammonium sulfate (AS), 6. S + B + HS + ammonium nitrate (AN).
Data availability statement
Presented data in this study are available on request from the corresponding author.