Figures & data
Figure 1. Waves of interest in the application of new digital technologies in planning practice.
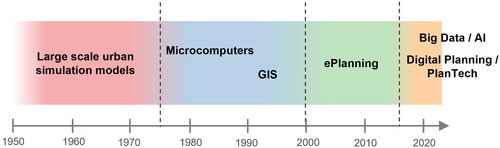
Table 1 Number of responses received by country.
Figure 2. “What type of software, web or phone applications do you use in your current role?” Software use reported by survey respondents, including statistical significance of intercountry variation.
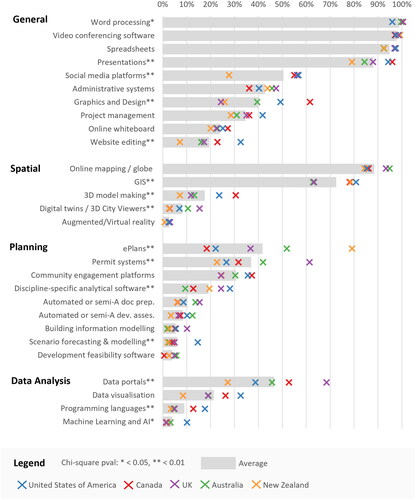
Figure 3. “What is the name of the software or application?” Diagram showing planning, spatial, or data analysis software packages named by respondents. Larger nodes and links indicate higher usage, with software located in the center of the diagram used by planners in multiple countries.
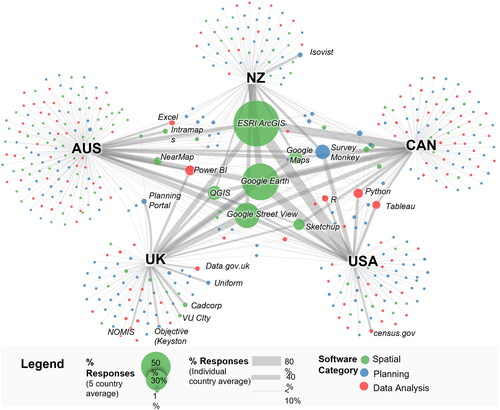
Figure 4. “What type of data do you refer to in your current role?” Data use reported by survey respondents, including statistical significance of intercountry variation.
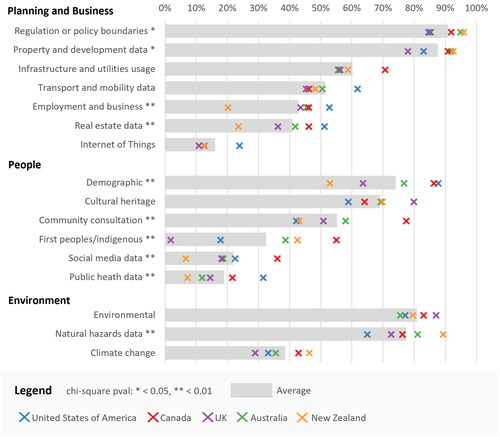
Figure 5. “How do you work with data in your role?” Data access arrangements reported by survey respondents including statistical significance of intercountry variations.
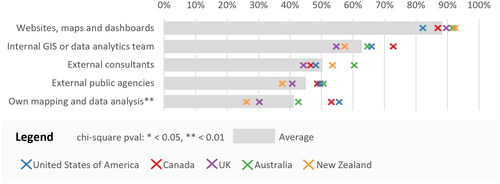
Figure 6. Distribution of responses to rank-scale questions regarding change and change preparedness including intercountry variation (not found to be statistically significant).
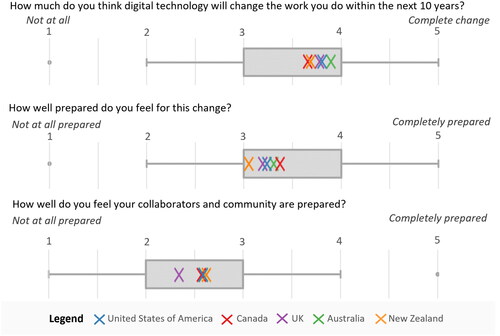
Figure 7. Comparison of common themes identified in short answer responses to questions: 1) “Please describe any changes you anticipate from digital technology,” 2) “If it was your decision, what changes would you make to technology use in your workplace and why?,” 3) “Your workplace is allocating time and money to improve the digital skills of employees. If it was your decision, what would your team learn and why?”
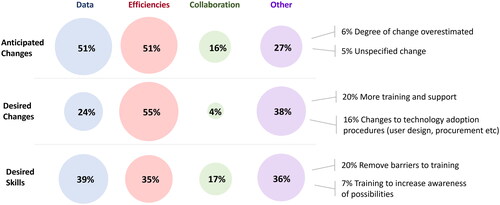
Figure 8. On a scale from 1 to 5, please rate the impact of the following common barriers to the adoption of technology in your workplace. Distribution of scores showing 1) intercountry variation and 2) public/private-sector comparison.
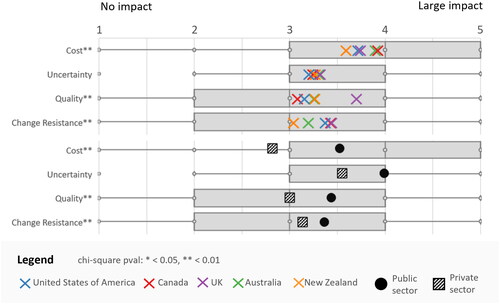
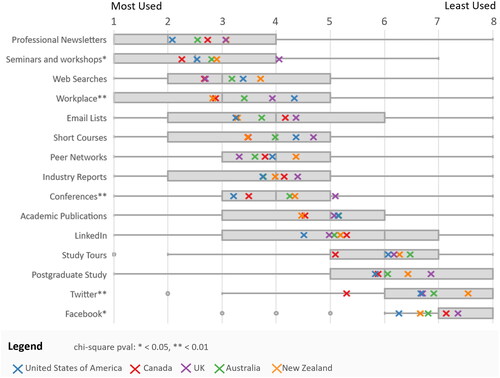
Figure 9. “Based on your personal usage, drag and drop the following items to rate how important the following sources are for you to keep up with the latest developments in planning.” Distribution of rank scores showing intercountry variation.