
Figures & data
Figure 1. Mixed-methods sequential explanatory design procedures.
Table 1. Demographic breakdown of questionnaire respondents.
Table 2. Descriptive analysis of students’ satisfaction in HL.
Table 3. Descriptive analysis of students’ self-efficacy in HL.
Table 4. Descriptive analysis of students’ engagement in HL.
Table 5. Correlation between self-efficacy, engagement and learning satisfaction.
Figure 2. Emerging themes from both phases.
Figure 3. The link between satisfaction, engagement and self-efficacy in hybrid learning.
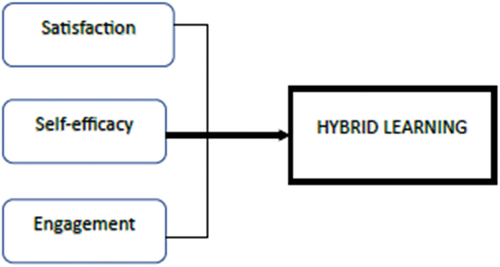
Table 6. Demographic breakdown of phase two participants.
Table 7. Emerging themes from qualitative analysis.