5,255
Views
77
CrossRef citations to date
0
Altmetric
Articles

Droughts in Pakistan: a spatiotemporal variability analysis using the Standardized Precipitation Index

, , &
Pages 620-631 | Received 30 Jan 2013, Accepted 11 Jul 2013, Published online: 06 Sep 2013

Figures & data

Table 1. The classification of drought severity based on the Standardized Precipitation Index (McKee et al., Citation1993)

Figure 1. Rain-gauge network in Pakistan.

Figure 1. Rain-gauge network in Pakistan.

Table 2. Rejection rates of the Kolmogorov–Smirnov goodness-of-fit test for gridded APHRODITE data

Figure 2. PCA loadings maps of SPI on (a) 3-month, (b) 6-month, and (c) 12-month scales.

Figure 2. PCA loadings maps of SPI on (a) 3-month, (b) 6-month, and (c) 12-month scales.

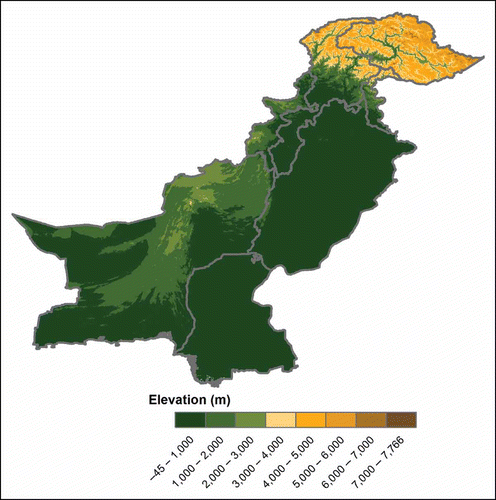
Figure 3. Elevation in Pakistan.

Figure 3. Elevation in Pakistan.

Figure 4. Scores of first principal component (PC1) for SPI on (a) 3-month, (b) 6-month, and (c) 12-month scales.
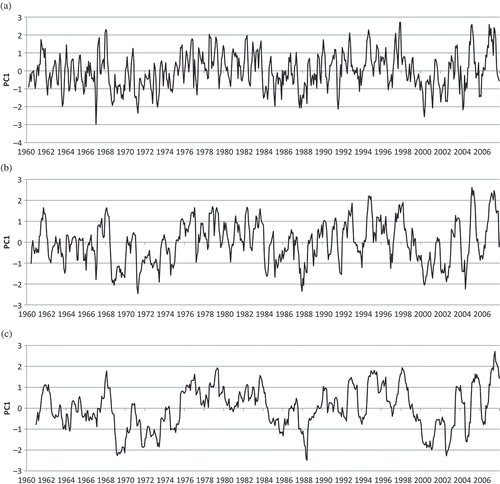
Figure 4. Scores of first principal component (PC1) for SPI on (a) 3-month, (b) 6-month, and (c) 12-month scales.

Table 3. Results of trend detection for PC1 scores
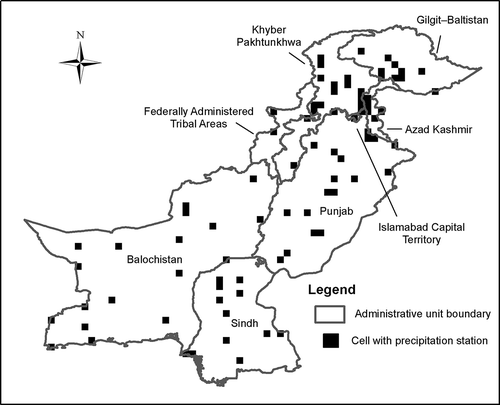
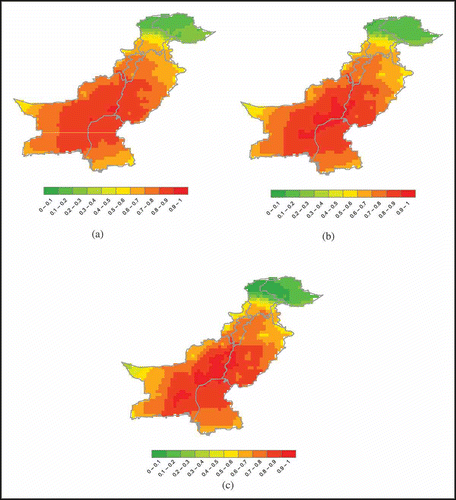
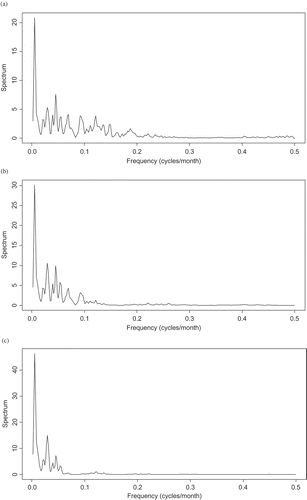
Figure 5. Periodograms of PC1 scores on (a) 3-month, (b) 6-month, and (c) 12-month scales.

Figure 5. Periodograms of PC1 scores on (a) 3-month, (b) 6-month, and (c) 12-month scales.

Figure 6. Temporal evolution of drought-affected area in Pakistan.

Figure 6. Temporal evolution of drought-affected area in Pakistan.