
Figures & data
Table 1. Number of participants and demographic information for each year of data collection for cohort 1, from kindergarten through 4th grade.a
Figure 1. Percentages of The Opportunity Project (TOP) and control group students who approach (Performance 1 or 2), meet (Performance 3), or exceed (Performance 4 or 5) standards for reading in 3rd and 4th grades. Note. Acad = Academic; Warn = Warning; App = Approaches; Stand = Standard; Exemp = Exemplary.
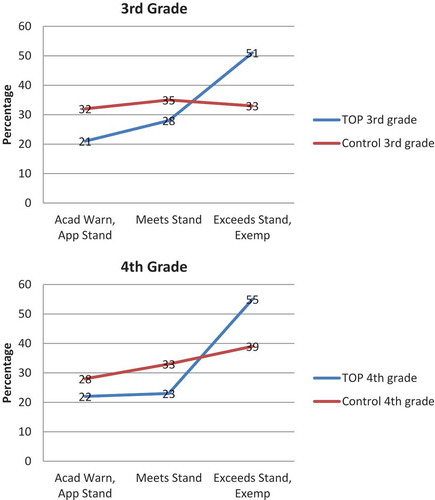
Figure 2. Percentages of The Opportunity Project (TOP) and control group students who approach (Performance 1 or 2), meet (Performance 3), or exceed (Performance 4 or 5) standards for math in 3rd and 4th grades. Note. Acad = Academic; Warn = Warning; App = Approaches; Stand = Standard; Exemp = Exemplary.
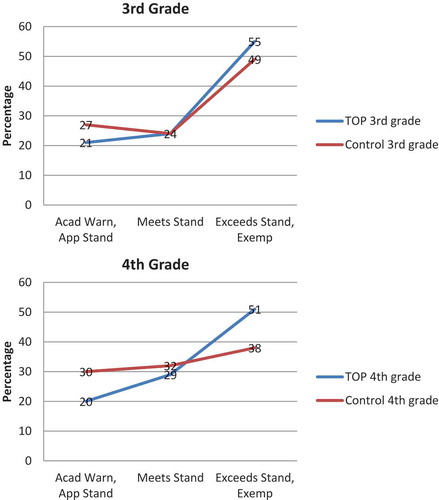
Table 2. Grade, mean teacher rating, and standard deviations for appropriate behavior, competent social interaction, and emotional maturity.
Figure 3. Percentage of students placed in special education for the The Opportunity Project (TOP) and control groups from kindergarten through the 4th grade.
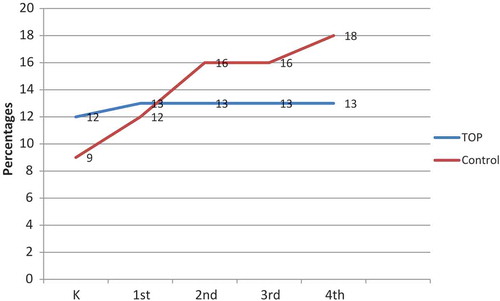
Figure 4. Average days absent for The Opportunity Project (TOP) and control group students from 1st through 4th grade.
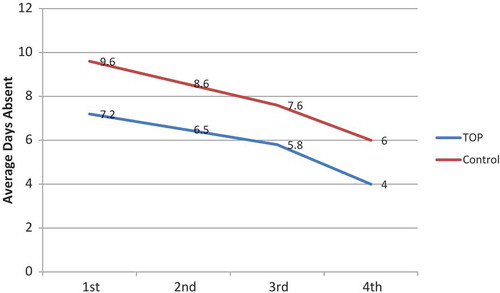
Table 3. Percent of students with repeat discipline referrals for The Opportunity Project students and control groups from 1st through 4th grades.
Table 4. Regression analysis for 3rd-grade The Opportunity Project and control groups for reading proficiency, math proficiency, special education placement, attendance, and repeat discipline referrals.
Table 5. Regression analysis for 4th-grade The Opportunity Project and control groups for reading proficiency, math proficiency, special education placement, attendance, and repeat discipline referrals.