
Figures & data
Table 1. Participation in non-formal training among all employees 20–65 years, by educational level and country (per cent).
Table 2. Participation in non-formal training among all employees 20–65 years, by immigrant background and group of countries (per cent).
Table 3. The distribution of training days (per cent) and the number of days in training (mean) among employees 20–65 years who had participated in non-formal training, by group of countries.
Table 4. The distribution of training days (per cent) among employees 20–65 years, who had participated in non-formal training by educational level and immigrant background.
Table 5. Estimated effects of workplace and individual characteristics on the probability of different intensities of participating in non-formal training.
Table 6. Estimated probability to participate in training of various duration, by educational level and group of countries.
Figure 1. Estimated probability to participate in training of various duration, by educational level, occupation and group of countries.
Notes: (1) The estimates in are based on the regression coefficients in for the high- and low-performing countries, respectively. (2) The respondents are assigned average values on all other variables than educational level and occupation, i.e. the average values for the four high- and the four low-performing countries, respectively (see Table A1).
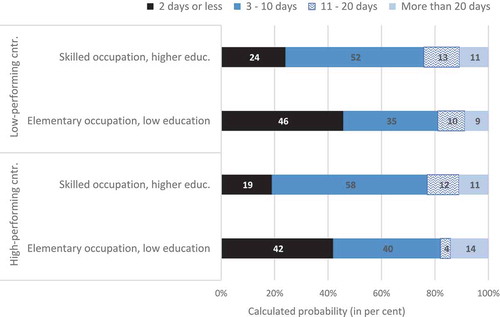
Figure 2. Estimated probability to participate in training of various duration, by immigrant background. High-performing countries.
Notes: (1) The estimates in are based on the regression coefficients in for the high- performing countries. (2) The respondents are assigned average values on all other variables than immigrant background, i.e. the average values for the four high-performing countries (see Table A1).
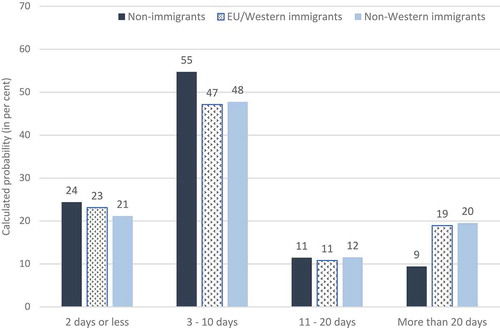
Figure 3. Estimated probability to participate in training of various duration, by country.
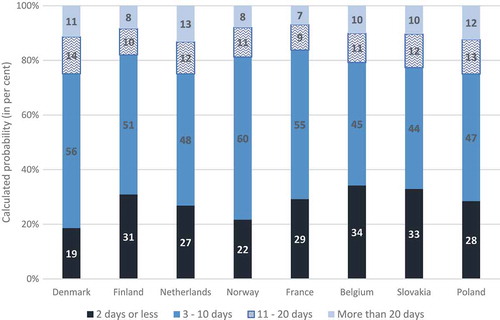
Table A1. Mean sample values of independent variables used in the regressions, by group of countries.
Table A2. The average number of training activities, by form of non-formal training and the number of days in training. Training activities among all employees 20–65 years who had participated in non-formal training.