
Figures & data
Figure 1. Participation rate in adult education and training (AET) by country. The whole population and working population. European countries1 participating in the 2013 PIAAC survey.
1Country abbreviations: FI= Finland, DK=Denmark, NL= the Netherlands, SE= Sweden, NO= Norway, UK=United Kingdom, IE=Ireland, EE= Estonia, CZ=Czech Republic, DE=Germany, BE=Belgium, ES=Spain, PL= Poland, SK=Slovak Republic, FR= France
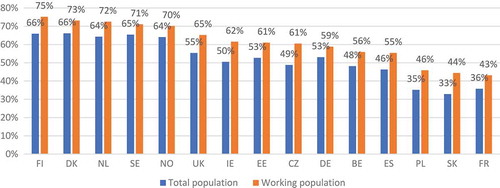
Table 1. Four groups of demand for AET by own educational level in European countries with high and low AET participation rate.
Table 2. Logistic regression on being in the ‘partially met demand’-group. Separate analyses for countries with high and low AET participation rate.
Figure 2. Four types of demand for AET, by country2. Eight countries participating in the 2013 PIAAC survey.
2Country abbreviations: NO= Norway, DK=Denmark, FI= Finland, SE= Sweden, NL= the Netherlands, FR= France, Pl= Poland, SK=Slovak republic
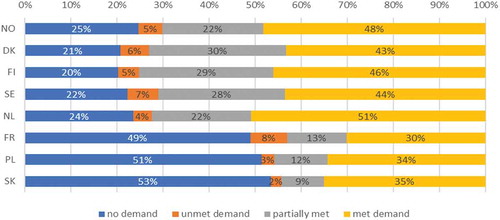
Figure 3. Estimated probability of being in the ‘partially met demand’ group in European countries with high and low participation rate, by various background characteristics. Calculations based on significant coefficients in the regression in .
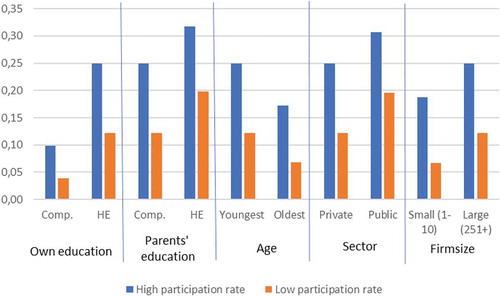
Table 3. Average frequency of barriers to AET participation in European countries with high and low participation rate.