
Figures & data
Table 1. Participation in non-formal job-related training by immigrant background. Per cent of employed persons.
Table 2. Binary logistic regression of the probability to participate in non-formal job-related training. Four countries*.
Figure 1. Estimated probability to participate in non-formal job-related training, by immigrant background.
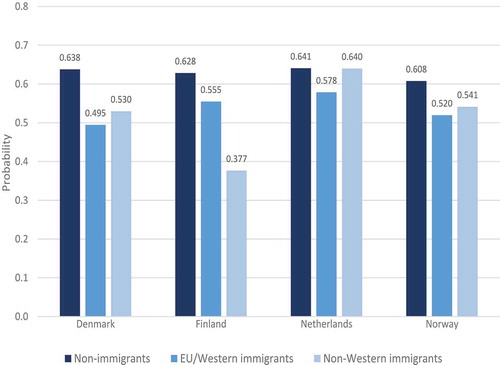
Figure 2. Participation in job-related training paid for by the employer and total participation rate, by immigrant background. Per cent.
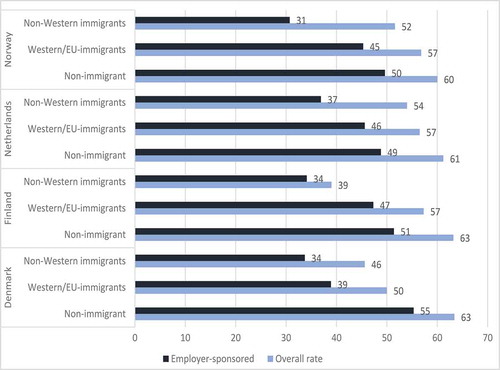
Table 3. Obligatory training or training of own interest, by immigrant background. Per cent*.
Table A.1. Mean sample values of independent variables by country and immigrant background. Employed persons*
Table A.2. Per cent employed by immigrant background and country. Percentage base (number of observations, total, and unweighted) in parenthesis.