Figures & data
Figure 1. The formative assessment cycle (Gulikers and Baartman Citation2017).
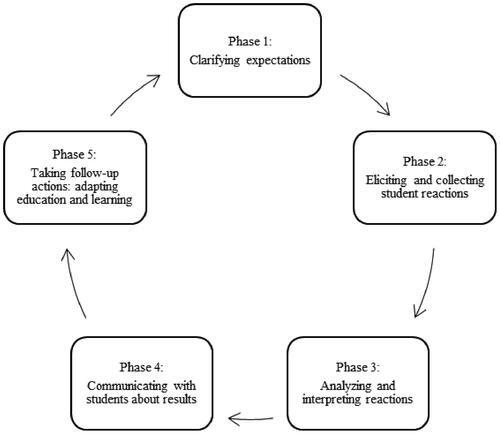
Figure 2. Practical example used in first training session.
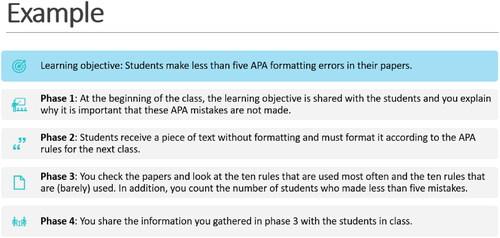
Figure 3. Practical example of using scaffolding strategies, used in second training session.

Table 1. Constructs measured with the Perceived Adaptivity Questionnaire.
Table 2. Goodness-of-fit indicators of models for perceived adaptivity (n = 173).
Table 3. Average adaptivity pre-test and post-test scores for the non-training, training group, and total (n = 173).
Table 4. MANOVA results over time and across groups (n = 173).
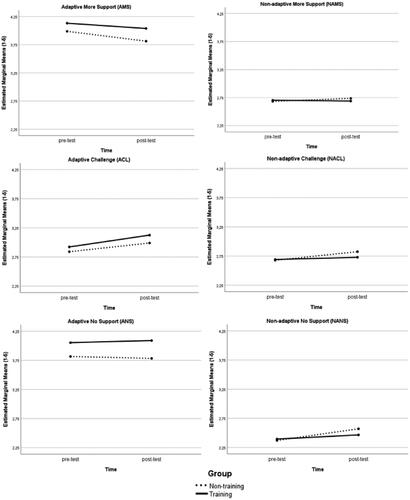
Figure 4. Estimated marginal means of perceived adaptivity scales (n = 173).