
Figures & data
Figure 1. Analytical model of the research questions.
Table 1. Descriptive statistics.
Figure 2. Relationship between digital learning practices and digital competence of students. n = 52,520. R square: 0.50. Notes: Dots indicate the beta values of the OLS regression, while horizontal lines show the 95% confidence interval using robust SE.
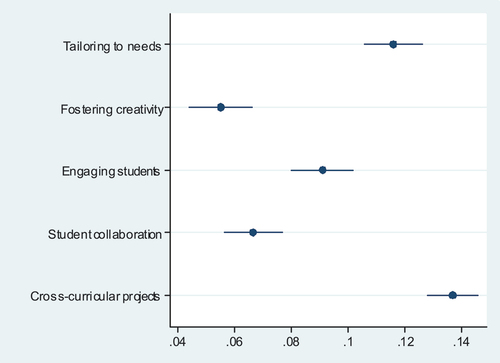
Figure 3. Relationship between the usefulness of professional learning activities and cross-curricular projects. n = 30,584 (only those with experience in all the above professional learning activities during the last year). R square:0.44. Notes: F2F stands for face-to-face. Dots indicate the beta values of the OLS regression, while horizontal lines show the 95% confidence interval using robust SE.
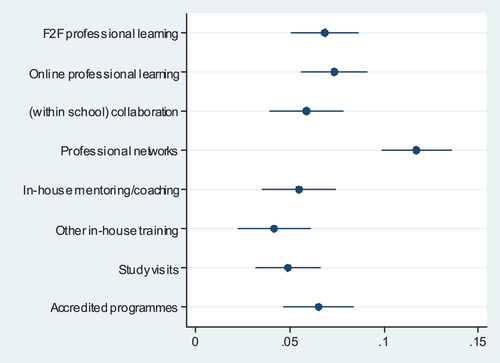
Figure 4. Main results of the analysis.
Table 2. Variables included in the models.
Table 3. Variables included in the robustness check (See footnote 16).