1,271
Views
15
CrossRef citations to date
0
Altmetric
Original Articles

Electromagnetic induction prediction of soil salinity and groundwater properties in a Tunisian Saharan oasis

Estimation de la salinité des sols et des propriétés de la nappe par induction électromagnétique dans une oasis du Sahara tunisien

, , &
Pages 1473-1486 | Received 24 Jun 2011, Accepted 08 Mar 2012, Published online: 04 Sep 2012

Figures & data

Fig. 1 Study area and sampling locations.

Fig. 1 Study area and sampling locations.

Table 1  Summary statistics of soil properties at various soil depths, groundwater properties, and EM38 measurements collected in various seasons and years (2001–2004). N: number of observations

Table 2  Summary statistics of soil properties for 0–0.6 and 0–1.2 m soil depths, groundwater properties, and EM38 readings collected during different March visits. N: number of observations

Fig. 2 Adjusted R 2 (R a 2) and mean square error (MSE) of predicting lnECe observed at various soil depth intervals and seasons (12 dates from 2001 to 2004) with various models (best SLR, Equationequations (1) and (3), and MLR). MLR1: EM variables and plot coordinate as predictors; MLR2: same inputs than MLR1 plus groundwater properties.
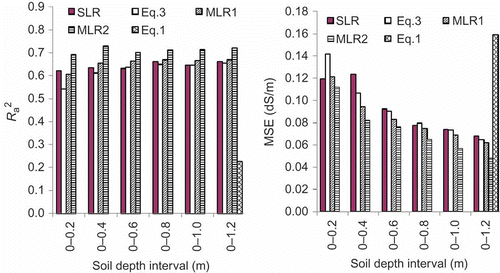
Fig. 2 Adjusted R 2 (R a 2) and mean square error (MSE) of predicting lnECe observed at various soil depth intervals and seasons (12 dates from 2001 to 2004) with various models (best SLR, Equationequations (1)(1) and (3), and MLR). MLR1: EM variables and plot coordinate as predictors; MLR2: same inputs than MLR1 plus groundwater properties.

Table 3  Performance of three models (SLR, Equationequations (1) and (3)) to predict the soil salinity (lnECe) from EM38 readings

Fig. 3 The R a 2 and MSE of predicting lnECe at various soil depths and dates of measurement using various models (Equationequations (1) and (3), best SLR and MLR1 models).

Fig. 3 The R a 2 and MSE of predicting lnECe at various soil depths and dates of measurement using various models (Equationequations (1)(1) and (3), best SLR and MLR1 models).
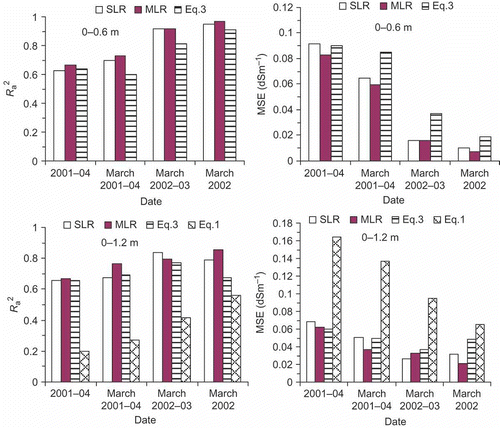
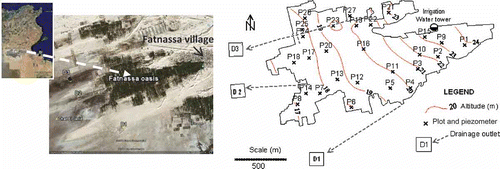
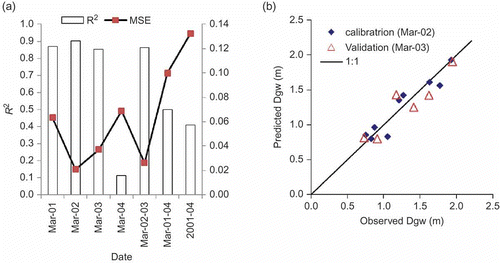
Fig. 4 (a) Performance of the best SLR model to predict Dgw from EMv at various time measurements. (b) Observed and predicted Dgw (m) for calibration (March 2002) and validation (March 2003) subsets.

Fig. 4 (a) Performance of the best SLR model to predict Dgw from EMv at various time measurements. (b) Observed and predicted Dgw (m) for calibration (March 2002) and validation (March 2003) subsets.

Reprints and Corporate Permissions

Please note: Selecting permissions does not provide access to the full text of the article, please see our help page How do I view content?

To request a reprint or corporate permissions for this article, please click on the relevant link below:

Academic Permissions

Please note: Selecting permissions does not provide access to the full text of the article, please see our help page How do I view content?

Obtain permissions instantly via Rightslink by clicking on the button below:

If you are unable to obtain permissions via Rightslink, please complete and submit this Permissions form. For more information, please visit our Permissions help page.