744
Views
4
CrossRef citations to date
0
Altmetric
Original Articles

Parametric study of a physically-based, plot-scale hillslope hydrological model through virtual experiments

Etude paramétrique d’un modèle hydrologique de versant à base physique à l’échelle de la parcelle par des expériences virtuelles

&
Pages 448-467 | Received 20 Sep 2012, Accepted 29 Jan 2014, Published online: 30 Jan 2015

Figures & data

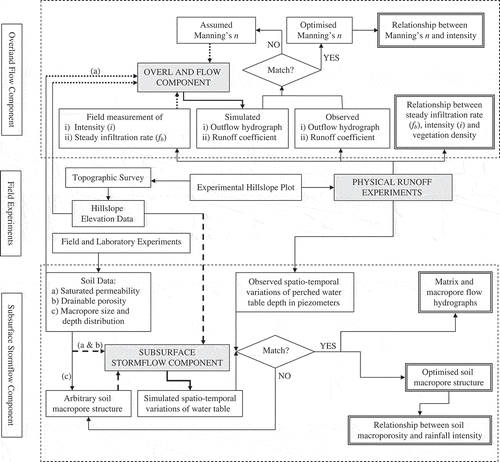
Fig. 1 A conceptual framework of the hillslope hydrological model.

Fig. 1 A conceptual framework of the hillslope hydrological model.

Fig. 2 Observed overland flow rates for a plot-scale runoff simulation experiment conducted with constant inflow intensity of 97 mm/h and 51 min duration under dense vegetation condition.
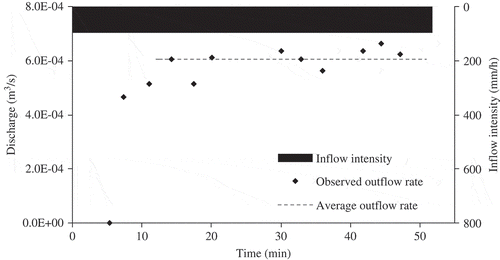
Fig. 2 Observed overland flow rates for a plot-scale runoff simulation experiment conducted with constant inflow intensity of 97 mm/h and 51 min duration under dense vegetation condition.

Fig. 3 Observed and simulated outflow rates for a plot-scale runoff experiment conducted with constant inflow intensity of 241 mm/h and 30 min duration under moderate vegetation condition.
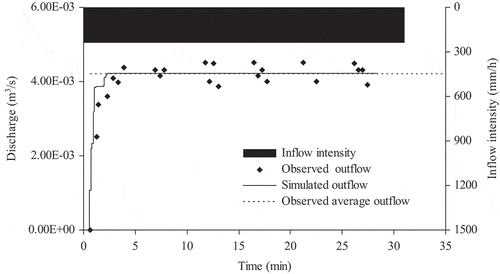
Fig. 3 Observed and simulated outflow rates for a plot-scale runoff experiment conducted with constant inflow intensity of 241 mm/h and 30 min duration under moderate vegetation condition.

Table 1 Observed and simulated overland flow characteristics for some of the runoff experiments conducted on the experimental hillslope plot.

Table 2 Observed and predicted water table depths above the impermeable layer for an experiment conducted with an average steady recharge rate of 139 mm/h for 48 min duration under dense vegetation conditions. PI: performance index.

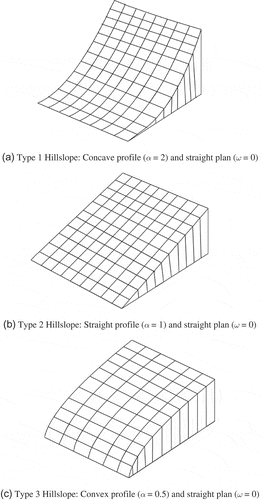
Fig. 4 (a)–(c) Three different topographical shapes of hillslope profile.

Fig. 4 (a)–(c) Three different topographical shapes of hillslope profile.

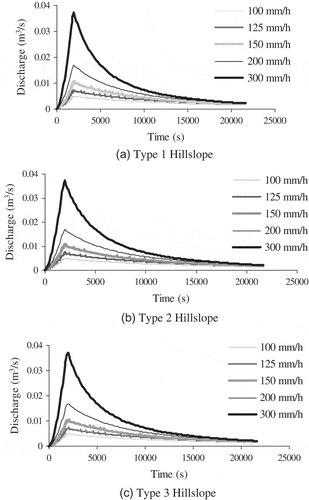
Fig. 5 (a)–(c) Overland flow hydrographs from different hillslopes under varying rainfall intensities.
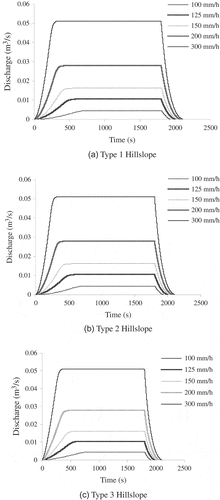
Fig. 5 (a)–(c) Overland flow hydrographs from different hillslopes under varying rainfall intensities.

Table 3 Effect of change in relief on overland flow hydrographs for i = 150 mm/h.

Table 4 Estimated normalized sensitivity coefficients (NSC) for the tested parameters of the model.

Fig. 6 (a)–(c) Subsurface flow hydrographs through soil macropores.

Fig. 6 (a)–(c) Subsurface flow hydrographs through soil macropores.

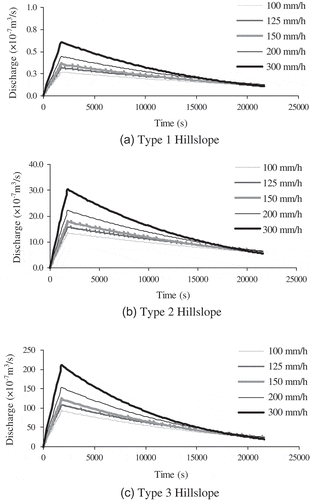
Fig. 7 (a)–(c) Subsurface flow hydrographs through soil matrix.

Fig. 7 (a)–(c) Subsurface flow hydrographs through soil matrix.

Table 5 Effect of change in relief on matrix flow hydrographs for i = 150 mm/h.

Table 6 Effect of change in soil macroporosity on subsurface stormflow for the Type 2 hillslope.

Table 7 Maximum height of water table above the impermeable bed under different rainfall intensities.

Table 8 Occurrence of saturation excess overland flow with no lateral macropores for the Type 2 hillslope.

Reprints and Corporate Permissions

Please note: Selecting permissions does not provide access to the full text of the article, please see our help page How do I view content?

To request a reprint or corporate permissions for this article, please click on the relevant link below:

Academic Permissions

Please note: Selecting permissions does not provide access to the full text of the article, please see our help page How do I view content?

Obtain permissions instantly via Rightslink by clicking on the button below:

If you are unable to obtain permissions via Rightslink, please complete and submit this Permissions form. For more information, please visit our Permissions help page.