Figures & data
Fig. 1 Locations of the three study catchments and four validation catchments (I and II); and bushfire extent (III) and logging extent (IV) for the three study catchments.
Table 1 Catchments attributes and calibration and test periods.
Table 2 Mean annual streamflow, rainfall and areal potential evapotranspiration (APET) for different periods for the three catchments. “start year” is the calibration start year of the streamflow record and “end year” is the end year of the streamflow record.
Fig. 2 Cumulative percentage of mortality/regrowth for the three study catchments: (a) mortality/regrowth for ash; (b) mortality/regrowth for all species.
Table 3 Overview of the characteristics for the three hydrological models.
Table 4 Free parameters of the three hydrological models.
Table 5 Optimal sets of free parameters from three hydrological models for the three study catchments.
Table 6 Calibration and validation results for the GR4J model in four undisturbed catchments.
Fig. 3 Variation of annual rainfall, observed and simulated annual streamflow at the three study catchments for the AWRA-L model: (a) Latrobe@Noojee, (b) Starvation Creek, and (c) Yarra River@Little Yarra. The two dashed vertical lines indicate the years 1983 and 1998.
Fig. 4 Variation of annual rainfall, observed and simulated annual streamflow at the three study catchments for the XAJ model: (a) Latrobe@Noojee, (b) Starvation Creek, and (c) Yarra River@Little Yarra. The two dashed vertical lines indicate the years 1983 and 1998.
Fig. 5 Variation of annual rainfall, observed and simulated annual streamflow at the three study catchments for the GR4J model: (a) Latrobe@Noojee, (b) Starvation Creek, and (c) Yarra River@Little Yarra. The two dashed vertical lines indicate the years 1983 and 1998.
Fig. 6 Comparison of observed and simulated daily streamflow for the Latrobe@Noojee catchment using the GR4J model: (a) Calibration, 1977–1978, and (b) Simulation, 1991–1992.
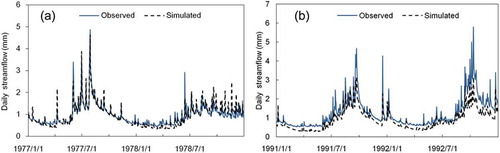
Table 7 Hydrological model calibration results for the three catchments.
Table 8 Effects of bushfire and climate variability on the mean annual streamflow for the three catchments.
Fig. 7 Summary of bushfire impact on annual streamflow (in mm) from 1983 to the end year of streamflow record for the three catchments. White boxplots: 1983 to 1998; grey boxplots: 1999 to the end year of record. For each catchment, the three white/grey boxplots represent total streamflow (mm) change relative to the pre-bushfire period (horizontal line), bushfire impact on streamflow (mm) (without notch), climate change impact on streamflow (mm) (with notch), respectively.
Fig. 8 Summary of bushfire impact on annual streamflow (%) from 1983 to the end year of record for the three catchments. White boxplots: 1983 to 1998; grey boxplots: 1999 to the end year of record. For each catchment, the three white/grey boxplots represent total streamflow change (%) relative to pre-bushfire period (horizontal line), bushfire impact on streamflow (%) (without notch), and climate change impact on streamflow (%) (with notch), respectively.