Figures & data
Figure 1. Study catchment and selected sub-catchments. Black circles are groundwater level monitoring points for the period 2010–13 and rain gauge locations (1) Monteverde, (2) Montecristo and (3) Ostional. Grey circles are locations of soil infiltration tests. Topographic contour resolution is 100 m.
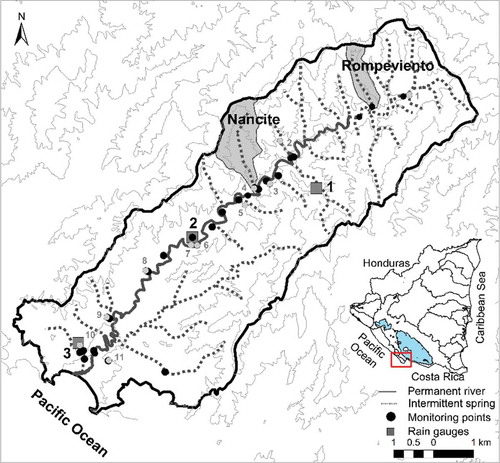
Table 1. Soil infiltration capacity.
Figure 2. Climatic water balance for the catchment for the period June 2010 to April 2013. (a) Monthly precipitation (P) for each station. (b) Reference evaporation (Eref) at each station. (c) P–Eref for the catchment based on areal weighted averages and average hydraulic head (h) fluctuations for wells at the three catchment communities.
Figure 3. Hysteresis in EC–discharge relationships during sub-catchment (a) and catchment (b and c) rainfall–runoff events. Hollow circles represent concentrations during the rising limbs, solid circles represent concentrations during the falling limbs, and arrows indicate time evolution.
Table 2. End-member composition for sub-catchment and catchment scale events.
Table 3. Summary of rainfall-runoff events. Runoff coefficients are based on δ18O hydrograph separations.
Figure 4. Hydrograph separation based on chloride and δ18O for events 1 and 2. Qt: total discharge, Qsr: surface runoff, Qssf: subsurface stormflow and Qgw: groundwater.
Figure 5. Hydrograph separation based on δ18O and δ2H for events 1 and 2. Qt: total discharge, Qe: event water contribution and Qp: pre-event water contribution.
Figure 6. Hydrograph separation based on chloride and δ18O for Events 3, 4 and 5. Qt: total discharge, Qsr: surface runoff, Qb: baseflow and Qgw: groundwater.
Figure 7. Hydrograph separation based δ18O and δ2H for Events 3, 4 and 5. Qt: total discharge, Qe: event water contribution and Qp: pre-event water contribution.
Figure 8. Conceptualization of runoff generation at sub-catchment (a) and catchment scale (b).
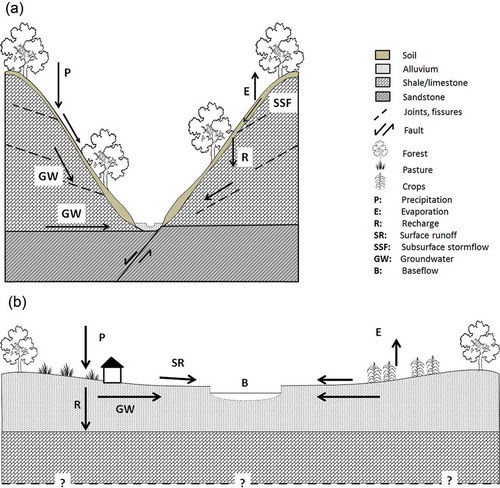
Figure A1. Travertine deposits encountered during the dry season 2011 at the headwaters of the catchment.
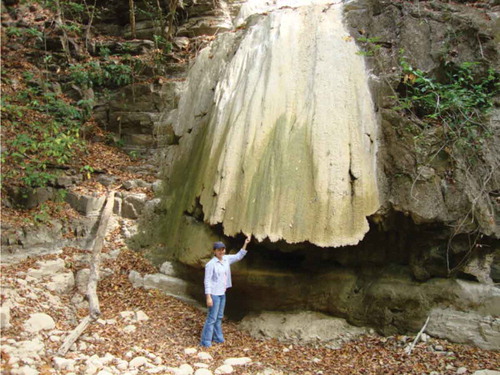
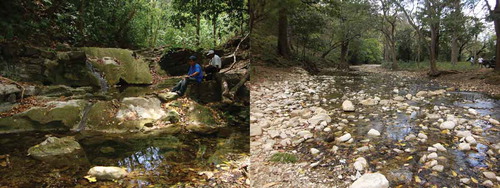
Figure A2. Different landscape characteristics at sub-catchment (a) and catchment (b) level.
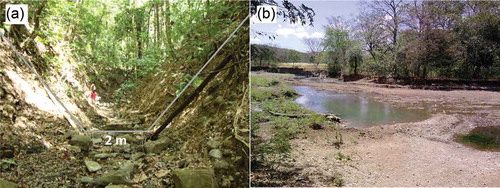
Figure A3. River baseflow during dry season 2012 in the upper catchment area.