Figures & data
Figure 1. Modelling steps in the LASH hydrological model for its grid-cell-based version, where P is the rainfall, ET is the actual evapotranspiration, DCR is the capillary rise, DS is the direct surface runoff, DSS is the subsurface flow, and DB is the baseflow.
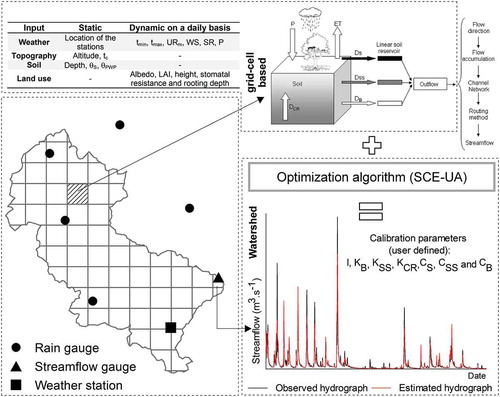
Figure 2. (a) Location of the Fragata River basin; (b) drainage area upstream from the Passo dos Carros outlet and the monitoring network used.
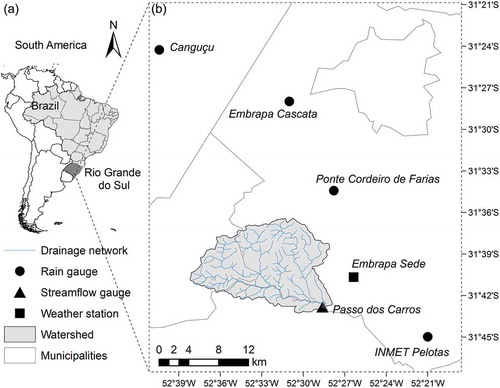
Table 1. Parameter values associated with land-use classes identified in the FRB-PC for hydrological modelling with LASH.
Figure 3. Land-use map for the FRB-PC.
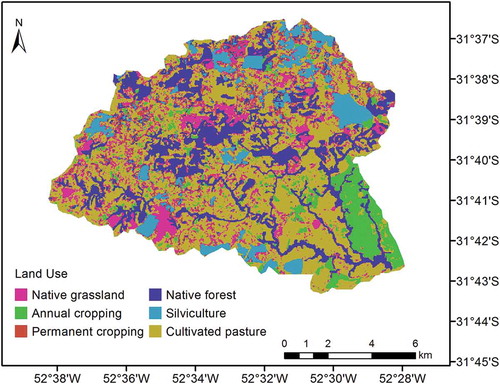
Figure 4. Main soil types in the FRB-PC and the 15 km spatial transect established for soil sampling.
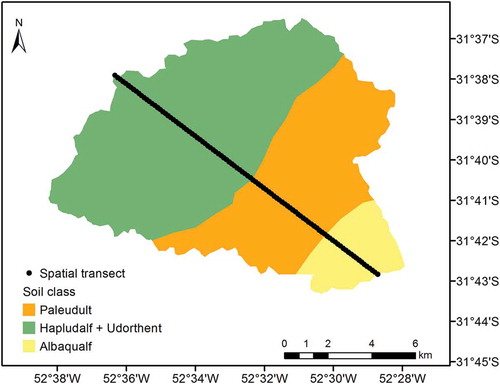
Table 2. Values of soil properties associated with land-use classes identified in the FRB-PC for hydrological modelling with LASH.
Table 3. Lower and upper bounds used for each parameter calibrated by the LASH model and the respective optimized values for the FRB-PC.
Figure 5. Hydrographs monitored in the FRB-PC and hydrographs estimated by the LASH model in the same basin for calibration (a) and validation (b) periods.
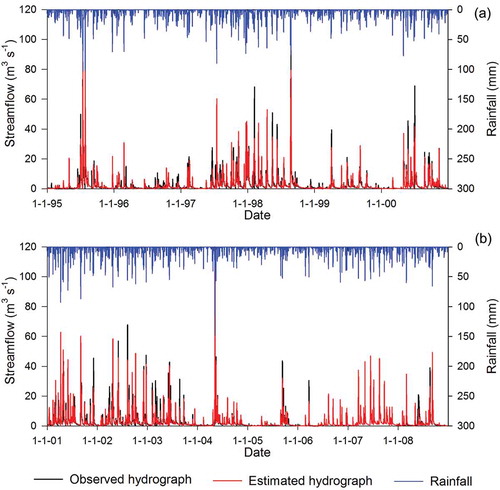
Table 4. Statistical measures to assess the performance of the LASH model in the calibration and validation steps for the FRB-PC.
Figure 6. Values observed in the FRB-PC, and those estimated by the LASH model for minimum annual streamflow (a), mean annual streamflow (b), and maximum annual streamflow (c).
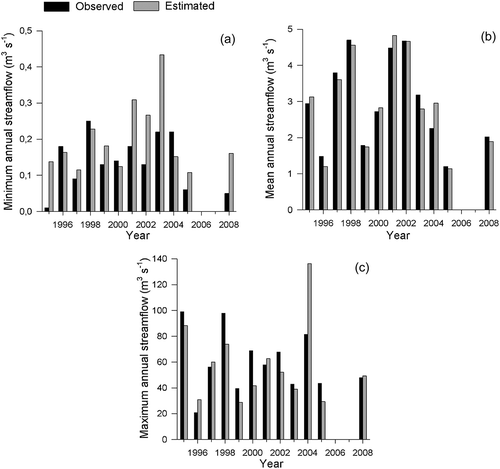
Figure 7. Observed flow–duration curve and curve estimated by the LASH model in the FRB-PC.
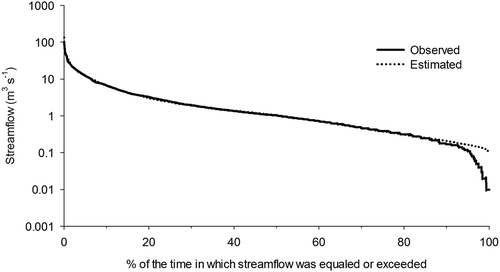
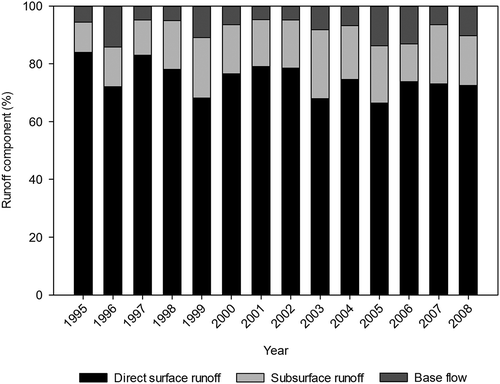
Figure 8. Percentage breakdown of each runoff component considering the hydrograph estimated by the LASH model from 1995 to 2008 in the FRB-PC.