Figures & data
Figure 1. Location of the REMEDHUS area representing soil moisture stations, weather stations and DGG centres of SMOS L2.
Table 1. REMEDHUS representative stations (topsoil properties). CV: coefficient of variation.
Table 2. Annual rainfall and aridity index (AI) during the calibration and validation periods.
Table 3. Range of calibrated parameter values based on Rawls et al. (Citation1982).
Table 4. Calibration and validation model results at the representative stations and for its application with averaged data. R: correlation coefficient; d: agreement index; RMSD: root mean square difference and bias in volumetric units (m3 m−3). All the correlations are significant at a 95% confidence level.
Figure 2. Modelled soil moisture (SWBM) vs in situ soil moisture (in situ) in the calibration (Cal) and validation periods (Val) for the M9, O7 and H13 stations and for the simulations with averaged data. The rainfall series of the La Granja and Cañizal weather stations and the average rainfall of the four weather stations are also shown.
Figure 3. Modelled soil moisture (SWBM) vs in situ observed soil moisture (in situ) in the calibration (Cal) and validation periods (Val) for the H9 and K10 stations and the rainfall series of the Cañizal and La Granja weather stations.
Table 5. Validation results of ascending (A) and descending (D) SMOS L2 series and the corresponding normalized SMOS series by linear regression (SMOSREG) and by CDF matching (SMOSCDF) vs in situ observations and vs the average of in situ observations within the 1913 DGG cell, and validation results of the averaged SMOS series vs the averaged in situ series of all the selected stations. N obs: number of observations; R: correlation coefficient; RMSD: root mean square difference and bias, both in volumetric units (m3 m−3). All the correlations are significant at a 95% confidence level.
Figure 4. Ascending (A) vs descending (D) SMOS L2 series of the DGG cells: 1400 (K4), 1912 (H9), 1913 (K10, L7, M9 and N9), 1914 (O7) and 2425 (H13).
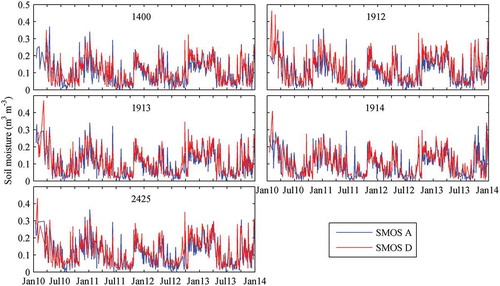
Figure 5. Time series of in situ (in situ) and SMOS ascending (SMOS) for the H9, M9, O7, H13 and K10 stations. The rainfall from La Granja and Cañizal weather stations is also shown.
Figure 6. Time series of averaged in situ (in situ) and averaged SMOS ascending (SMOS) of the selected stations and the average rainfall.
Figure 7. Time series of in situ (in situ) and of normalized SMOS ascending by linear regression (SMOSREG) and by CDF matching (SMOSCDF) for the H9, M9, O7, H13 and K10 stations and for the average of the selected stations.
Table 6. Validation results of ascending (A) and descending (D) SMOS L2 series and the corresponding normalized SMOS series by linear regression (SMOSREG) and by CDF matching (SMOSCDF) vs modelled series and vs the averaged modelled series within the 1913 DGG cell, and validation results of averaged SMOS series vs modelled series using averaged data. N obs: number of observations; R: correlation coefficient; RMSD: root mean square difference and bias, in volumetric units (m3 m−3). All the correlations are significant at a 95% confidence level.
Figure 8. Time series of modelled observations (SWBM) and SMOS ascending (SMOS) for the H9, M9, O7, H13 and K10 stations. The rainfall pattern of La Granja and Cañizal weather stations is also shown.
Figure 9. Time series of modelled observations using averaged data (SWBM) and of averaged SMOS ascending (SMOS) data and the average rainfall.
Figure 10. Time series of modelled (SWBM) and of normalized SMOS ascending by linear regression (SMOSREG) and by CDF matching (SMOSCDF) for the H9, M9, O7, H13 and K10 stations and for the average of the selected stations.