Figures & data
Figure 1. Study area and the hydrometeorological stations used.
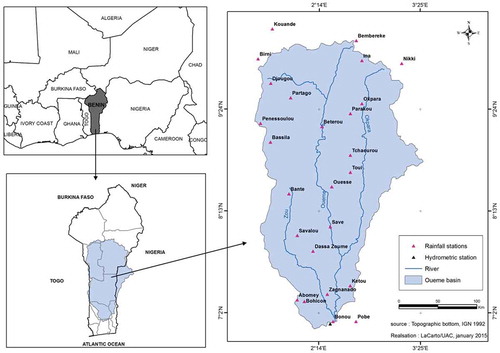
Table 1. Performance criteria of the hydrological model based on the least action principle (HyMoLAP) for the Bonou catchment, Ouémé River.
Figure 2. Simulated hydrograph compared with the observed discharge (calibration) for the Bonou catchment.
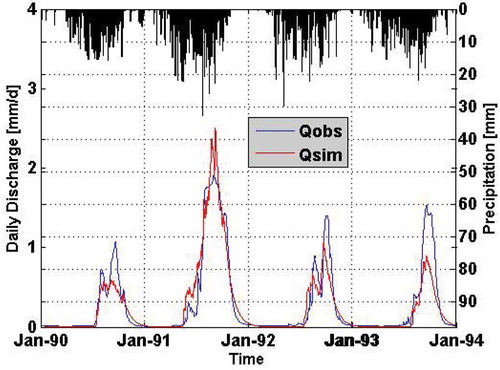
Figure 3. Simulated hydrograph compared with the observed discharge (validation) for the Bonou catchment.
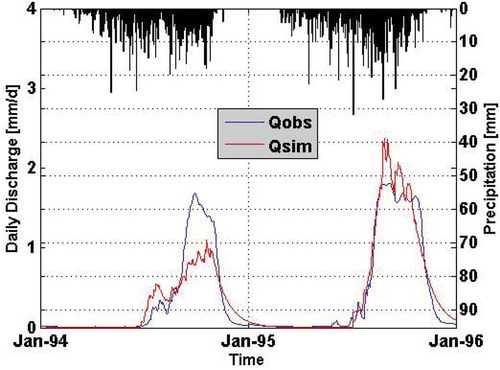
Figure 4. The normal probability plot with 95% confidence interval of the random component of rainfall for the Bonou catchment.
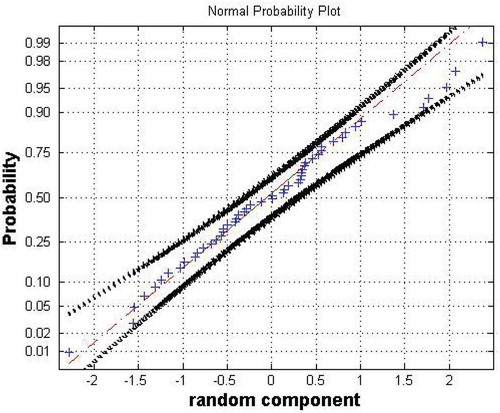
Figure 5. Autocorrelation function (ACF) and partial autocorrelation function (PACF) for the series of increments of the random component of rainfall for the Bonou catchment. The horizontal lines give the threshold above which the correlation is significant at the level α = 0.05.
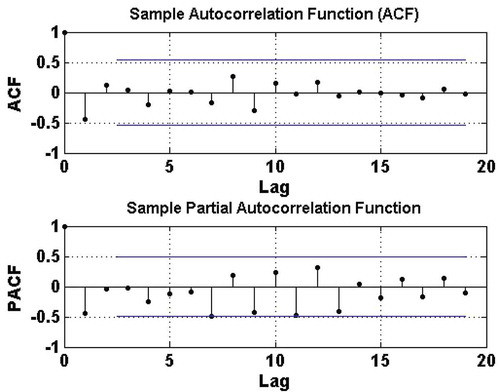
Figure 6. Fundamental distribution P(u,t) of the standardized daily discharge u for the Bonou catchment for the period 1961–2010. The colours toward the blue end of the colour map indicate low probability and the colours at the red end of the colour map indicate high probability.
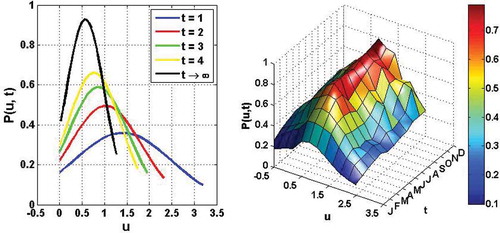
Figure 7. Approximate distributions P(u,t) with Hermite polynomials up to order n = 4 of the standardized daily discharge u for the Bonou catchment, for the period 1961–2010. See for explanation.
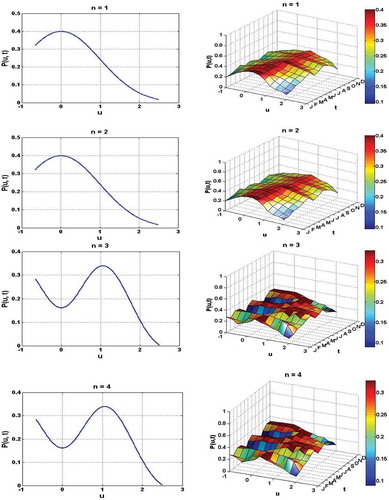
Figure 8. Approximate distributions P(u,t) with orthogonal polynomials associated with Student’s t distribution up to order k = 4 of the standardized daily discharge u for the Bonou catchment, for the period 1961–2010.
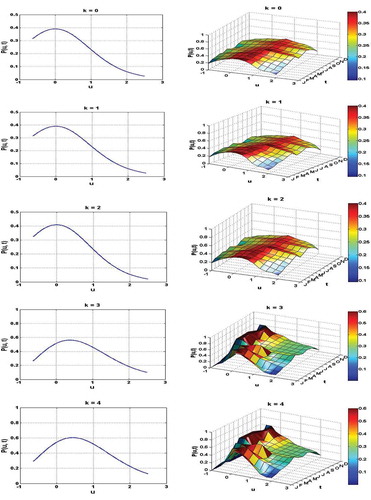
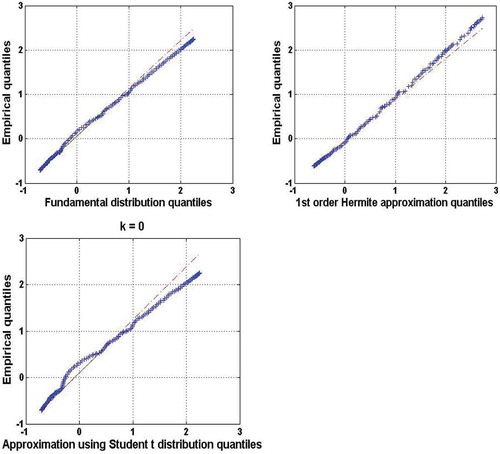
Figure 9. Q–Q plot for standardized daily discharge for the Bonou catchment, for the period 1961–2010.