Figures & data
Table 1. Major characteristics of the study catchments.
Figure 1. (a) Maps of locations and hypsometric curves for the study catchments; (b) mean annual (from hourly observations) precipitation–elevation relationships; (c) model structure (grid cell) based on Kirchner’s runoff response routine. The snow routine is based on Kolberg and Gottschalk (Citation2006). Qinst is instantaneous runoff, Qgi denotes average runoff (over the time step) generated at the grid cells, and Qsim denotes routed simulated flow.
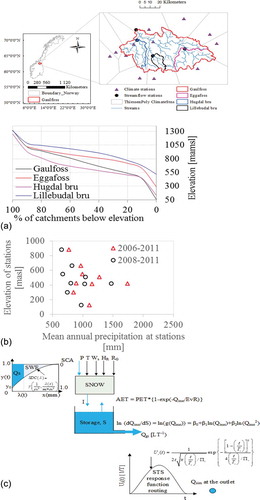
Figure 2. (a) Flow recession rates and fitted recession plots; (b) ln(−dQ/dt) versus ln(g(Q)) plots showing effects of the lower end of the recession.
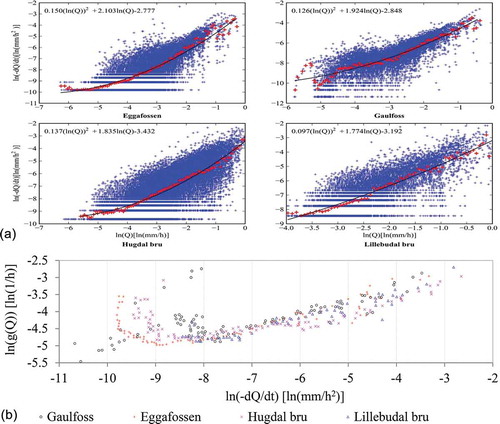
Table 2. Parameters and their prior ranges.
Table 3. Estimated and calibrated parameters corresponding to NSE for Gaulfoss.
Table 4. Parameter correlation matrix (r), and maximum and minimum values of marginal posterior parameters from calibration (runoff-routed) for Gaulfoss.
Table 5. Results for maximum values of NSE for parameter estimation from recession segments and calibration for Gaulfoss, and temporal and spatial transferability or validation for “proxy ungauged” internal sub-catchments.
Figure 3. Hydrographs for Gaulfoss corresponding to the NSE: (a) regression parameters estimated from recession (runoff routed); (b) calibrated parameters (runoff routed); and (c) calibrated parameters (runoff unrouted). Simulation for calibrated or estimated parameters (1 September 2008–1 September 2010) and simulation for temporal validation (1 September 2010–1 September 2011). P represents IDW interpolated and catchment averaged precipitation.
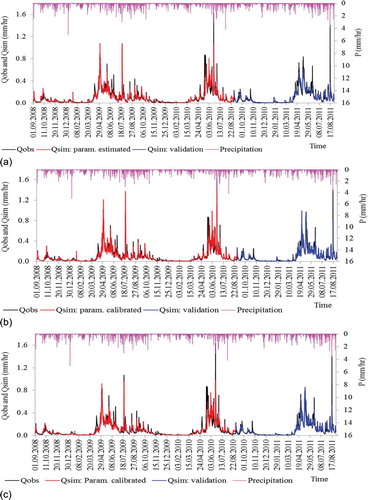
Figure 4. (a) Typical results from diagnostic of the regression for the recession analysis: normality test for Hugdal bru (left), residuals plot for Gaulfoss (middle) and systematic lack of fit due to missing quadratic term for Eggafoss (right); (b) 95% ICL and JCR for regression parameters for Gaulfoss; (c) parameter uncertainty in terms of histograms of marginal posteriors from calibration (runoff-routed) for Gaulfoss.
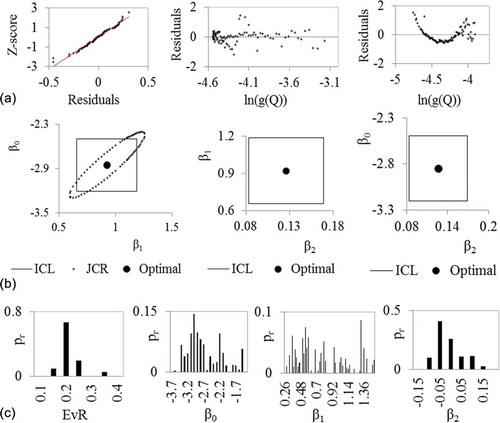
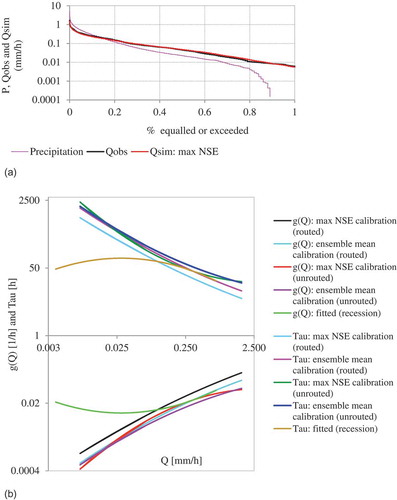
Figure 5. (a) Precipitation and streamflow duration curves and (b) discharge sensitivity function (g(Q)) and “response time” (τ) for Gaulfoss. The g(Q) and τ were computed based on Equation (4) from the regression parameters estimated or obtained by calibration.