
Figures & data
Table 1. Description of the network of hydrological of stations in Kemaman (Sources: DID, JUPEM and MMD).
Figure 1. Distribution of hydrological network stations in Kemaman district.
Table 2. Hydrological behaviour of the river stage stations.
Figure 2. Typical serial–parallel (SP) architecture of NARX network, where Z-1 is the unit time delay, is the estimated value.
Figure 3. Dendrogram showing the dissimilarity and clustering of the 10 rainfall stations.
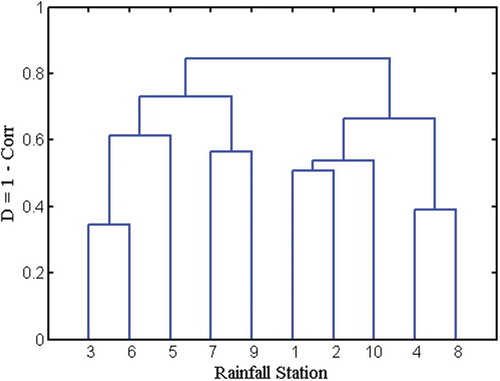
Figure 4. Scree plot showing total dissimilarity as a function of cluster number.
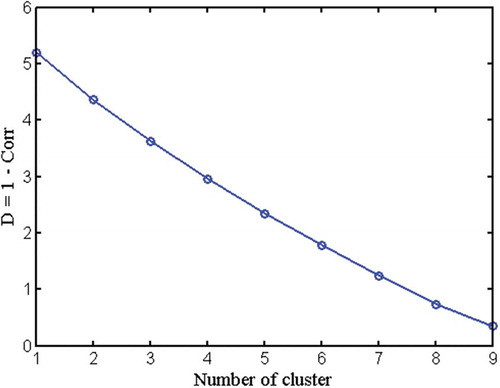
Figure 5. Cross-correlation function (CCF) of rainfall stations in Cluster A (left column) and Cluster B (right column) on river stage stations 1–4 (top to bottom).
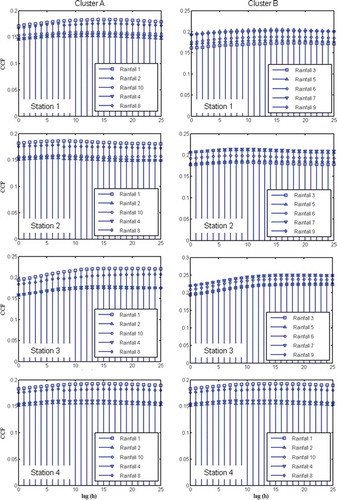
Figure 6. Cross-correlation function (CCF) of (a) temperature, (b) humidity and (c) evaporation on river stage stations 1–4.
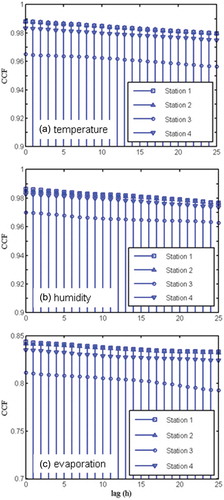
Figure 7. Effect of number of neurons on (a) correlation coefficient (R) and (b) root mean square error (RMSE) (Li = Lf = 6).
Figure 8. Autocorrelation function (ACF) (top row) and partial autocorrelation function (PACF) (bottom row) of rainfall stations in Cluster A (left) and Cluster B (right).
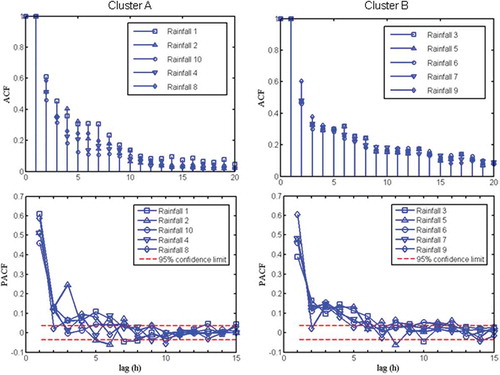
Figure 9. Partial autocorrelation function (PACF) of river stage stations 1–4.
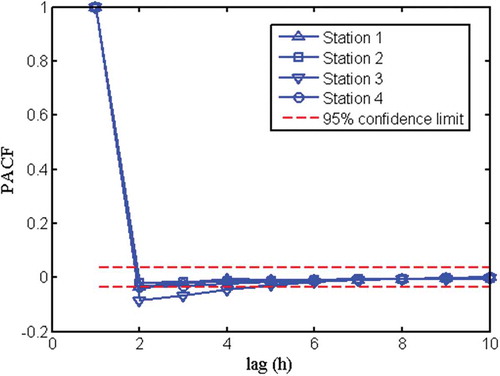
Table 3. Performance of the NARX model for different input delay and feedback delay (Li = Lf; number of neurons in hidden layer = 4).
Figure 10. Schematic diagram of the NARX network model.
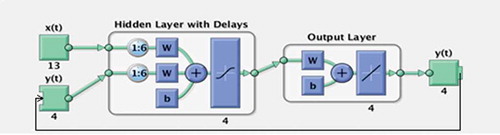
Figure 11. Network validation for July 2009, showing poor predictions in recession curves.
Figure 12. Effect of input data length on (a) correlation coefficient (R) and (b) root mean square error (RMSE) during network training.
Table 4. Validation results of the NARX model for July 2009 using different training data length (Li = Lf = 6; number of neurons in hidden layer = 4).
Figure 13. Effect of input data length on (a) correlation coefficient (R) and (b) root mean square error (RMSE) during network validation for July 2009.
Figure 14. NARX network validation for July 2009 using 120-day training dataset.
Figure 15. NARX network validation for May–December 2009 using 120-day training dataset.
Table 5. Validation results of the NARX model for May–December 2009 using 120-day training data length (Li = Lf = 6; number of neurons in hidden layer = 4).
Table 6. Network training using 120-day data for FFBP, GRNN, RBFNN and NARX.
Figure 16. Schematic diagram of the NARX network model with one-step-ahead predictions.
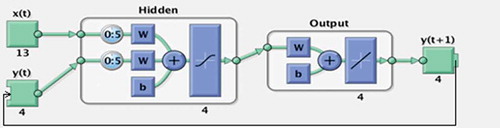
Table 7. Validation results of the one-step-ahead NARX model for May–December 2009 using 120-day training data length (Li = Lf = 6; number of neurons in hidden layer = 4).
Figure 17. NARX one-step-ahead predictions for May–December 2009.
Figure 18. Tidal stations considered: Chendering (48507) and Kuantan (48485), nearest to the Kemaman River mouth.
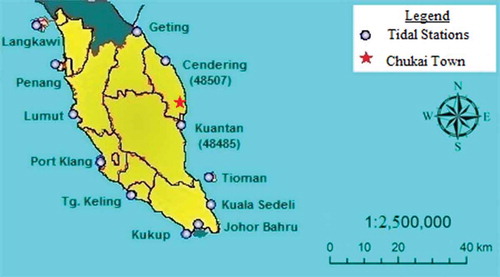
Figure 19. Hourly tidal hindcast using FFBP network (I10H7O1) for tidal station 48507, showing replaced missing data for the period 15:00 11 December 2008 to 13:00 13 January 2009 (R = 0.9683, RMSE = 0.0026).
Table 8. Comparison of NARX network training for Model I and Model II using 120-day dataset.
Table 9. Comparison of the NARX network validation for Model I and Model II for the period 1 May 2009–31 December 2009.