
Figures & data
Figure 1. The Glafkos River catchment in western Greece.
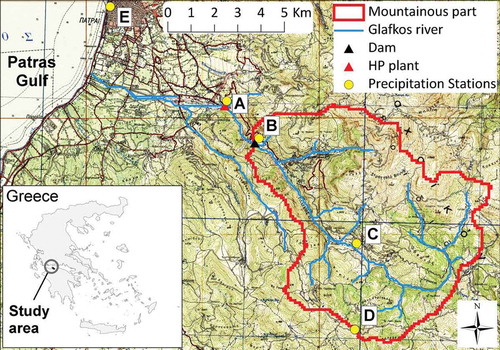
Figure 2. (a) Spatially averaged annual precipitation (P) and measured annual runoff (RO) for the period from 1974/75 to 1992/93. (b) Comparison between the analytically estimated actual evapotranspiration (Turc’s method) and the difference (P − RO).
Figure 3. Schematic representation of the conceptual structure of the ENNS model (Nachtnebel et al. Citation1993). Asterisks indicate modifications to the original interpretation of the corresponding hydrological processes.
Table 1. ENNS model parameters and their corresponding ranges of variation. Parameters varied during model calibration are shown in bold.
Table 2. Parameter ranges and optimal parameter sets of ensembles 1 and 2, investigated using the ENNS model.
Table 3. MIKE SHE model parameters and their corresponding ranges of variation. Parameters varied during model calibration are shown in bold.
Figure 4. Similar to Figure 3, but for the MIKE SHE model.
Table 4. Optimal parameters for the MIKE SHE model.
Figure 5. Criteria values for the ENNS simulations using parameter sets PSE1 and PSE2, and for the MIKE SHE simulations. (a) CrWB, (b) CrQ, (c) and (d) CrlogQ.
Figure 6. (a)–(e) Comparison of measured and simulated hydrographs using the ENNS and MIKE SHE models for the period from 1984/85 to 1988/89. (f) Annual runoff (RO) and change of storage.
Figure 7. Comparison of the actual evapotranspiration simulated by ENNS and MIKE SHE: (a) and (b) daily values for year 1984/85, (c) annual values.
Figure 8. Comparison of the total infiltration and its components simulated by ENNS and MIKE SHE: (a) total infiltration, (b) infiltration through the macropores, (c) infiltration through the soil matrix and (d) annual values.
Figure 9. Comparison of (a, b) daily values and (c) annual values of the direct runoff simulated by ENNS and MIKE SHE.
Figure 10. Comparison of daily and annual values of the baseflow simulated by ENNS and MIKE SHE.
Figure 11. Values of criteria CrWB, and for the ENNS and MIKE SHE simulations for the years from 1975/76 to 1992/93.
Figure 12. Comparison of the annual depths of (a) direct runoff and (b) baseflow simulated by ENNS and MIKE SHE for the period from 1975/76 to 1992/93.
Table A1. Spearman’s rank correlation coefficients (SRCCs) of criteria CrQ, , CrlogQ and CrWB, calculated independently for each year in the calibration period.