
Figures & data
Figure 1. Location of the study area.
Table 1. Derived spectral indices (B2: green band; B3: red band; B4: near-infrared band; B5: shortwave infrared band of the Landsat 7 image).
Figure 2. Flowchart of the classification process.
Figure 3. RF classification results using (a) 4–5–7 TM bands; (b) PCA, all TM bands; (c) all WIs; and (d) MNDWI.
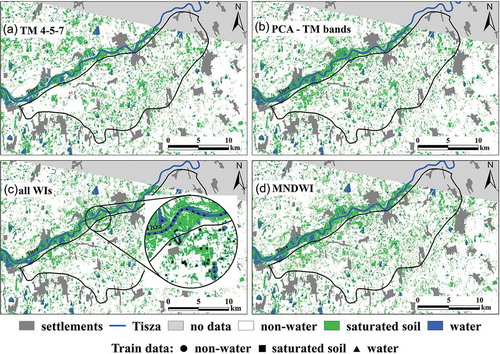
Table 2. Producer’s accuracy of water features and overall accuracy (OA) % of the classifications performed on original Landsat 7 bands using RF and SVM classifiers.
Table 3. Producer’s accuracy of water features and overall accuracy (OA) % of the classifications performed on WIs derived from Landsat 7 bands using RF and SVM classifiers.
Table 4. Producer’s accuracy of water features and overall accuracy (OA) % of the classifications with all WIs and with a set of WIs (McF: McFeeters).
Table 5. Producer’s accuracy of water features and overall accuracy (OA) %of the classifications performed on PCs derived from original Landsat 7 bands (TM bands) and WIs, using RF and SVM classifiers.
Table 6. Distribution of water-related categories by land-cover classes of CLC 2000 (minimum and maximum values).
Figure 4. Bi-plot diagram of the PCs derived from TM bands (categories are grouped by colours: (a) non-water; (b) saturated soil; (c) water; 95% ellipses).
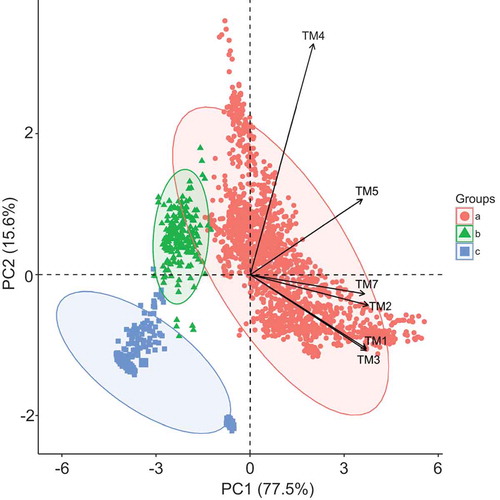
Figure 5. Bi-plot diagram of the PCs derived from WIs (categories are grouped by colours: (a) non-water; (b) saturated soil; (c) water; 95% ellipses).
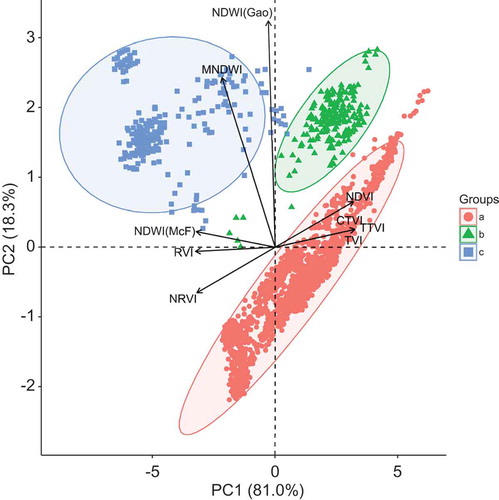
Figure 6. Map of standard deviation (SD) calculated from the six most accurate classifications including the cumulative histogram of the SD values.
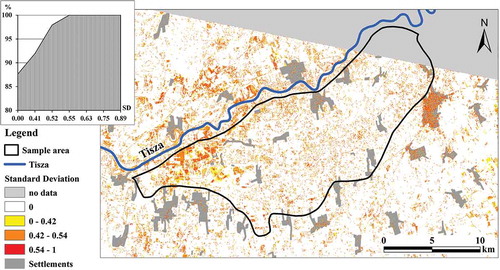
Table 7. Classification uncertainty of the best six classified maps (PCs derived from TM bands with RF; TM bands with RF; 4–5–7 TM bands with SVM; PCs derived from WIs with SVM; WIs with RF; MNDWI with RF) considering the standard deviation (SD) of the categories by CLC class.
Table 8. Classification accuracies of the Landsat 5 image of 19 June 2006 using different input data (WIs: water indices; TM bands; and PCs of PCA solutions) and classification algorithms. RF: random forest; SVM: support vector machine.
Table 9. Accuracy of image analysis techniques by the data types involved in previous studies.