Figures & data
Figure 1. Study area of the Grand River, Ohio, USA (Grand River watershed).
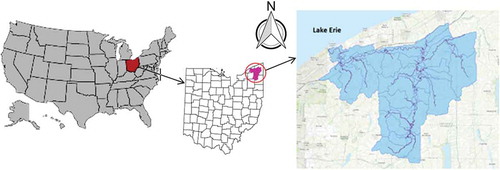
Table 1. Datasets used in the study.
Figure 2. Land-use data (30-m resolution) map of the Grand River watershed, Ohio. NLCD (2011).
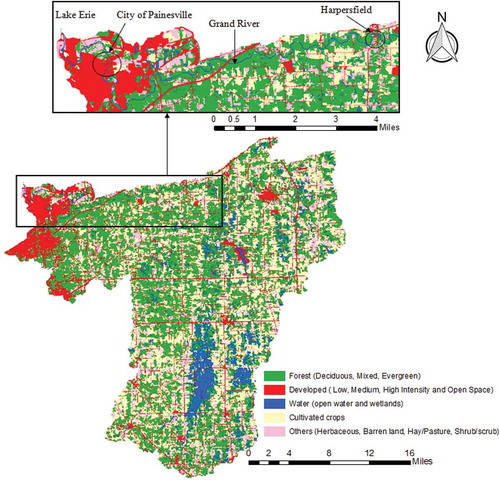
Figure 3. LiDAR DEM with cross-section configurations of the Grand River. Red dots show where cross-sections from different elevation datasets are compared (as shown in ); green dots show surveyed sections along the Grand River.
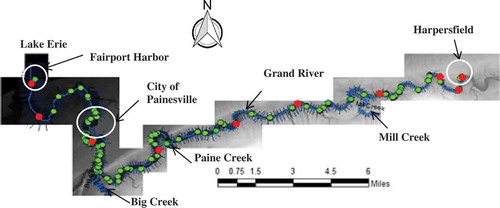
Figure 4. Hydraulic model of the Grand River as developed in HEC-RAS.
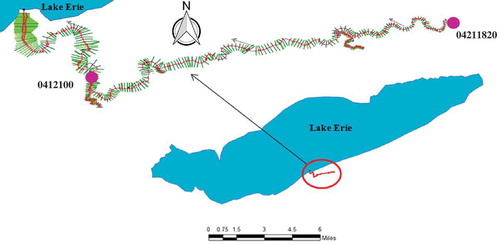
Table 2. Calibration/validation for stage at upstream gage station 04211820.
Table 3. Calibration/validation for discharge at downstream gage station 04212100.
Figure 5. Stage calibration (a) 1–31 March 1996 and (b) 15 April–14 May 1996, and (c) validation 5–19 March 1997 at upstream gage station 04211820.
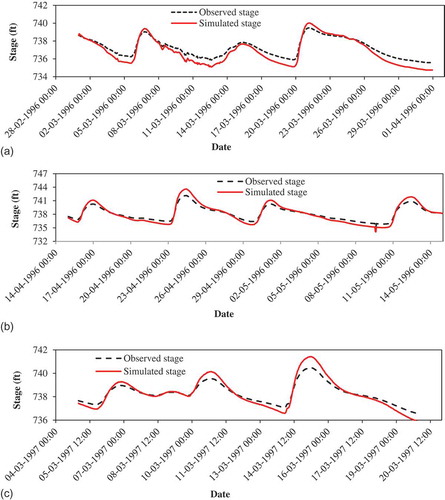
Figure 6. Discharge calibration (a) 1–31 March 1996 and (b) 15 April–14 May 1996, and (c) validation 5–19 March 1997 at downstream gage station 04212100.
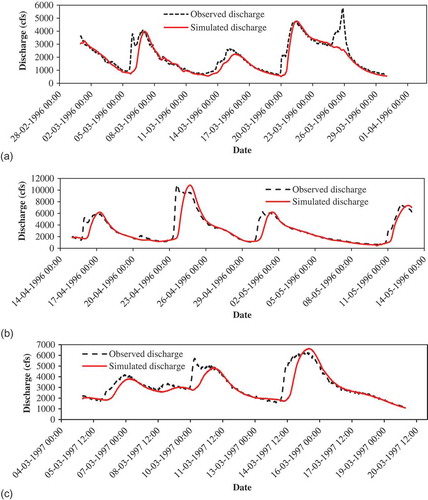
Table 4. Effect on travel time due to the variation in river discharge.
Figure 7. Cross-sections at different points along the Grand River: (a) 170 766.4, (b) 167 516.6, (c) 160 741, (d) 146 411.3, (e) 117 638.8, (f) 100 566.7, (g) 71 922.68, (h) 42 626.06, (i) 10 210.82 and (j) 3803.34. Survey data for 10 210.82 and 3803.34 cross-sections have been taken from the survey documents of US Army Corps of Engineers Buffalo District. Survey was performed by a sounding method.
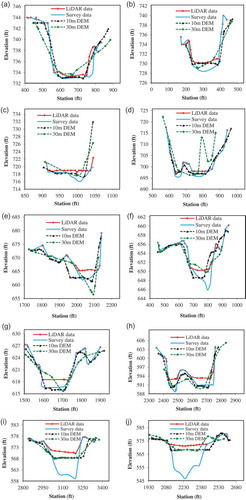
Figure 8. Travel time and difference in travel time for different return period floods to reach the City of Painesville using different elevation datasets. Percentage decrease/increase in travel time and inundation area for different elevation datasets was computed by comparing with the results calculated using LiDAR with survey.
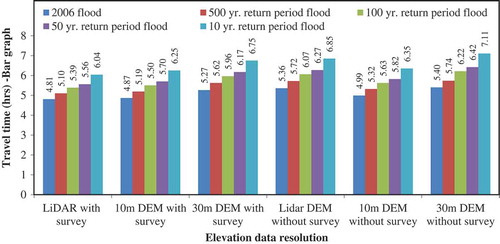
Figure 9. Travel time and percentage difference in travel time for different return period floods to reach Fairport Harbor using different elevation datasets.
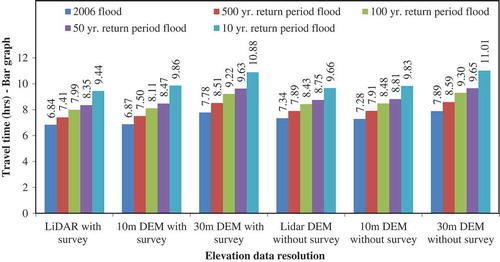
Table 5. Decrease in inundation area when survey data are incorporated.
Figure 10. Inundation area and percentage difference in inundation area for different return period floods and elevation datasets. Percentage decrease/increase in travel time and inundation area for different elevation datasets was computed by comparing with the results calculated using LiDAR with survey.
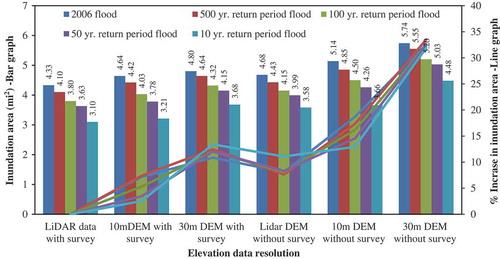
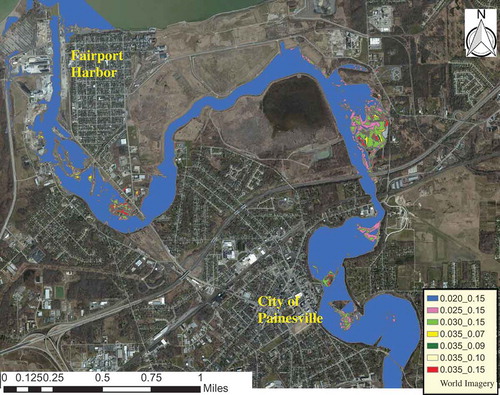
Figure 11. Difference in inundation area due to 2006 flooding in the Grand River generated using different elevation datasets. Note: The pink on the map covers all areas shaded in pink as well as blue; the yellow covers all areas in blue, pink and yellow, and the red represents the 30-m DEM without survey showing areas shaded in red and all the areas that are included in all other cases.
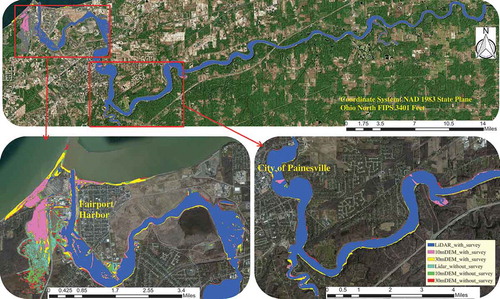
Table 6. Travel time to City of Painesville for different Manning’s roughness (n) values.
Figure 12. Travel times for various flood stages in the Grand River to reach the City of Painesville and Fairport Harbor.
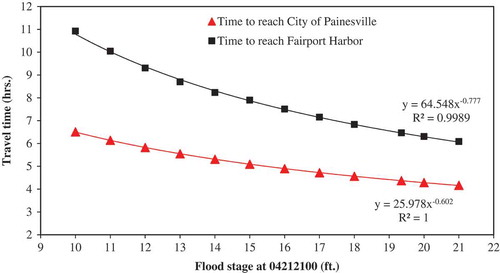
Figure 13. Percentage decrease in inundation area for different values of Manning’s roughness.
Figure 14. Differences in flood inundation maps for different Manning’s roughness values.