
Figures & data
Figure 1. Hydrological data and publication in the past, present (current) and future.
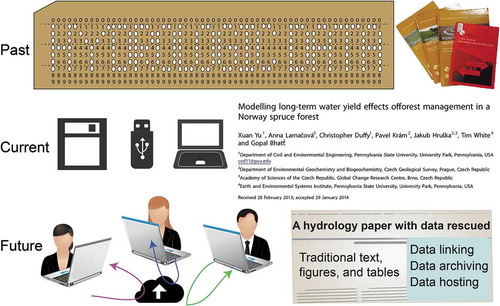
Table 1. Data linking sources, codes, and figures.
Figure 2. Workflow of each dataset. The workflow is presented backwards so that readers can easily find the datasets relevant to their interested scientific knowledge presented in figures.
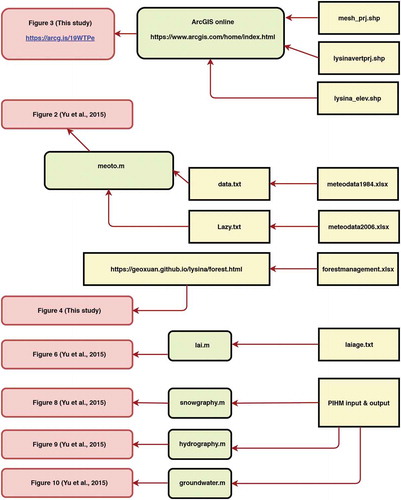
Figure 3. Geospatial data hosted by ArcGIS online. We selected ArcGIS online as host because it provides both visualization and source data.
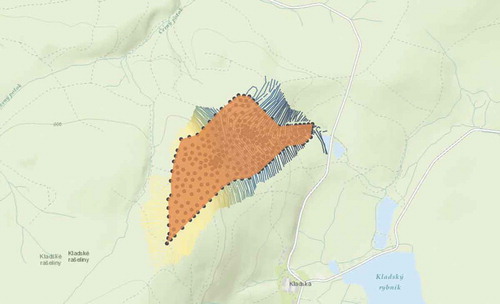
Figure 4. Spatial-temporal visualization of tree age change due to forest management. This is only a snapshot of the interactive visualization. For dynamic visualization animate, please open the html file in a web browser, which give readers straightforward understanding on forest management.
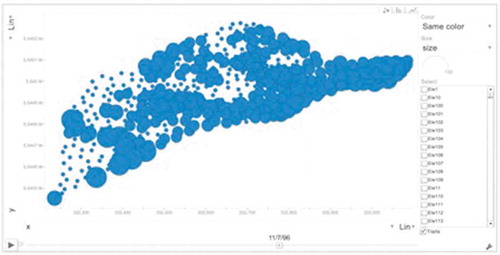
Table 2. Data archives and properties.
Table 3. Data hosting and repositories.