Figures & data
Figure 1. Interplay of hydrogeological hazards and society (adapted from Di Baldassarre et al. Citation2018b).
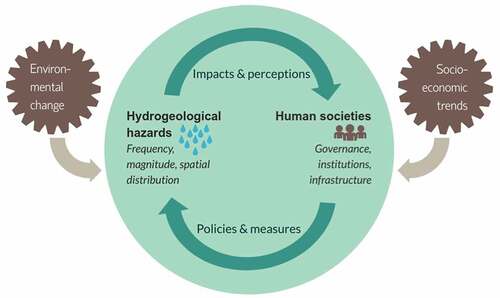
Table 1. Descriptive statistics (age and gender) for the four samples. M: mean; SD: standard deviation.
Table 2. Results of the chi-squared (χ2) contingency table tests for the three “Perceived threat” variables (df = 4). Bold indicates significant results.
Figure 2. Results of the questionnaire regarding the perceived threat to the respondent’s home, physical integrity, and town, on a scale from 1 (minimal threat) to 5 (serious threat).
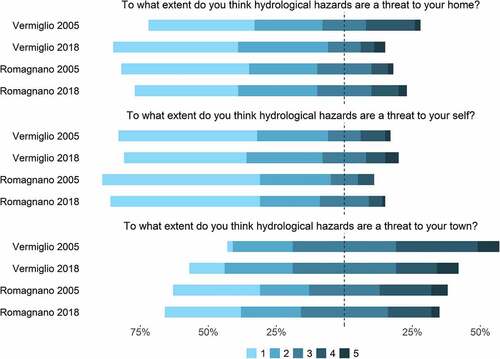
Table 3. Results of the χ2 contingency table tests for the “perceived likelihood” variable (df = 2).
Figure 3. Results of the questionnaire regarding the perceived likelihood of hydrogeological phenomena.
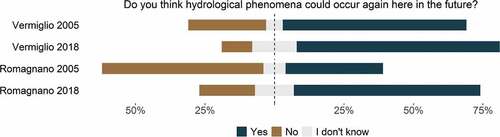
Figure 4. Results of the questionnaire regarding the respondents’ self-assessed changes in hydrogeological risk awareness and preparedness, on a scale from 1 (decreased) to 5 (increased), with 3 indicating no change.
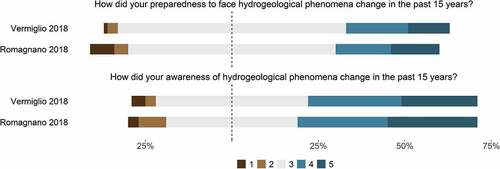
Table 4. Results of the χ2 contingency table tests for the two “preparedness” variables (df = 4). Bold indicates significant results.
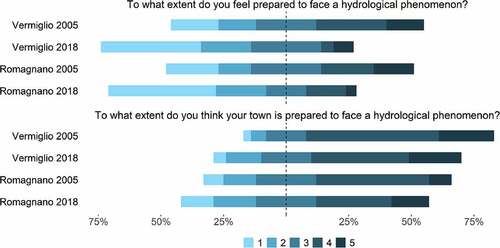
Figure 5. Results of the questionnaire regarding the respondent’s perceived individual preparedness and perceived town preparedness, on a scale form 1 (barely prepared) to 5 (highly prepared).