Figures & data
Figure 1. Location of the selected study catchments.
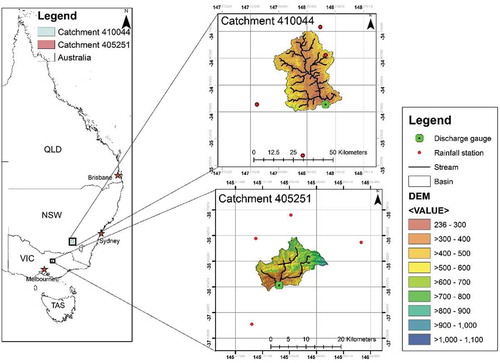
Figure 2. Land-use/land cover map (2012) of catchments (a) 405251 and (b) 410044.
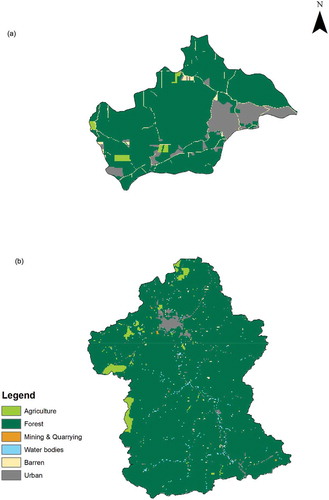
Figure 3. Periods during which the hydrological models were calibrated and validated.
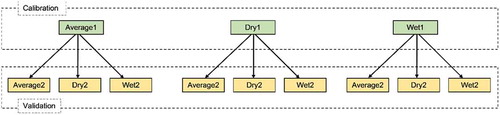
Table 1. Sensitivity analysis of SWATgrid model parameters at catchment 410044.
Table 2. IHACRES, HEC-HMS and SWATgrid model parameter definitions, units and their range used in this study.
Table 3. Average, Dry and Wet periods chosen for catchments 405251 and 410044.
Figure 4. Average1, Average2, Dry1, Dry2, Wet1 and Wet2 periods chosen for model calibration and validation in this study for catchments (a) 405251 and (b) 410044 (MAR represents mean annual rainfall for the whole data record).
Figure 5. Flow–duration curves for model comparison during (a) calibration (Average1), (b) validation (Average2), (c) validation (Dry2) and (d) validation (Wet2) in case of catchment 405251 (vertical grey lines indicate the division of 10% and 90% flows).
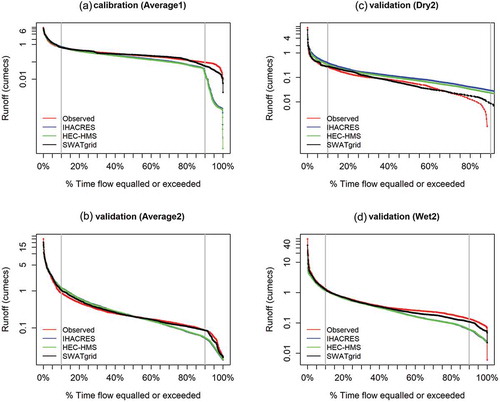
Table 4. Model comparison statistics during calibration in Average1 and validation in Average2, Dry2 and Wet2 periods at catchment 405251. Bold figures represent values within an acceptable range as detailed in Section 3.5.
Table 5. Model comparison statistics during calibration in Dry1 and validation in Average2, Dry2 and Wet2 periods at catchment 405251. Bold figures represent values within an acceptable range as detailed in Section 3.5.
Figure 6. Flow–duration curves for model comparison during (a) calibration (Dry1), (b) validation (Average2), (c) validation (Dry2) and (d) validation (Wet2) in case of catchment 405251 (vertical grey lines indicate the division of 10% and 90% flows).
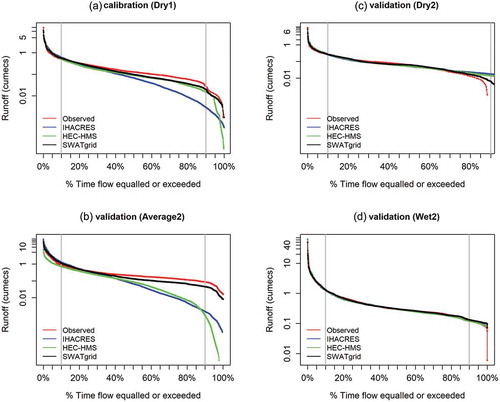
Table 6. Model comparison statistics during calibration in Wet1 and validation in Average2, Dry2 and Wet2 periods at catchment 405251. Bold figures represent values within an acceptable range as detailed in Section 3.5.
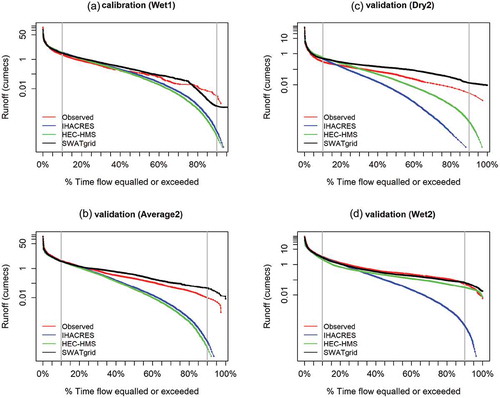
Figure 7. Flow–duration curves for model comparison during (a) calibration (Wet1), (b) validation (Average2), (c) validation (Dry2) and (d) validation (Wet2) in case of catchment 405251 (vertical grey lines indicate the division of 10% and 90% flows).
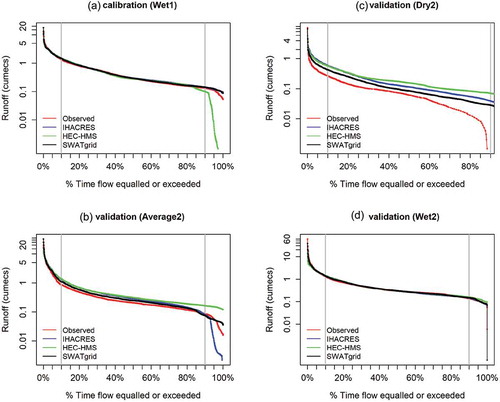
Table 7. Model comparison statistics during calibration in Average1 and validation in Average2, Dry2 and Wet2 periods at catchment 410044. Bold figures represent values within an acceptable range as detailed in Section 3.5.
Figure 8. Flow–duration curves for model comparison during (a) calibration (Average1), (b) validation (Average2), (c) validation (Dry2) and (d) validation (Wet2) in case of catchment 410044 (vertical grey lines indicate the division of 10% and 90% flows).
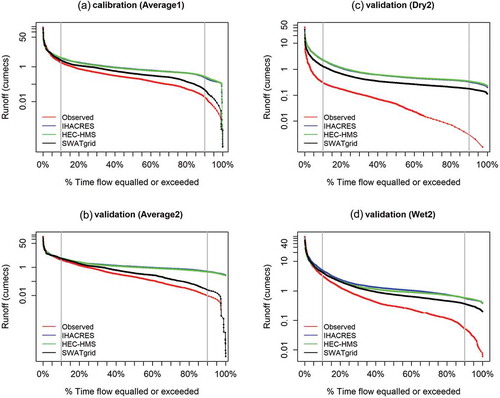
Table 8. Model comparison statistics during calibration in Dry1 and validation in Average2, Dry2 and Wet2 periods at catchment 410044. Bold figures represent values within an acceptable range as detailed in Section 3.5.
Figure 9. Flow–duration curves for model comparison during (a) calibration (Dry1), (b) validation (Average2), (c) validation (Dry2) and (d) validation (Wet2) in case of catchment 410044 (vertical grey lines indicate the division of 10% and 90% flows).
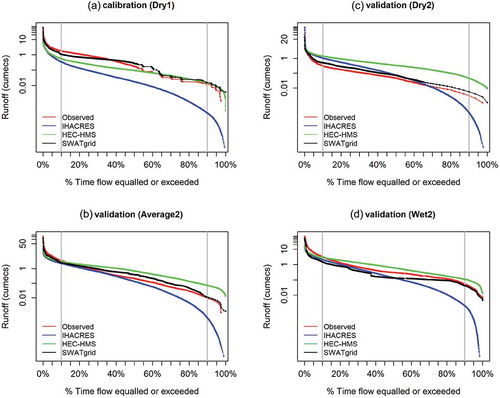
Table 9. Model comparison statistics during calibration in Wet1 and validation in Average2, Dry2 and Wet2 periods at catchment 410044. Bold figures represent values within an acceptable range as detailed in Section 3.5.
Figure 10. Flow–duration curves for model comparison during (a) calibration (Wet1), (b) validation (Average2), (c) validation (Dry2) and (d) validation (Wet2) in case of catchment 410044 (vertical grey lines indicate the division of 10% and 90% flows).