
Figures & data
Figure 1. Study area in the Pampa del Tamarugal Aquifer: (a) the main points of interest addressed in Scheihing (Citation2018). (b) The 2012–2015 groundwater levels, aquifer extent and hydrogeological cross-section, extracted from Viguier et al. (Citation2019a).
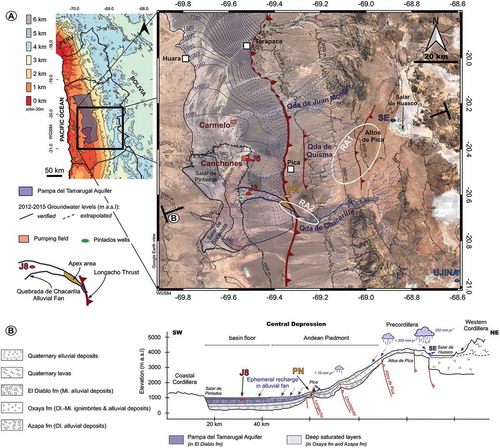
Figure 2. Vertical lithological and hydrogeological information at J6 and J8 observation boreholes, after JICA (Citation1995)
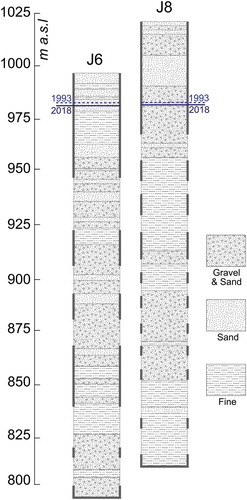
Figure 3. Hydrological and hydrogeological time series. (a) Oceanic Niño Index (http://origin.cpc.ncep.noaa.gov/products/analysis_monitoring/ensostuff/ONI_v5.php). Grey, red and blue curves display, neutral, El Niño and La Niña phases of the ENSO, respectively. (b) Monthly precipitation (mm) at Ujina meteorological station in the Andes (4300 m a.s.l.). Data is available at the DGA website (www.dga.cl). (c) Groundwater level time series (m a.s.l.) at J6 and J8, located at ~500 m and ~17 km from the Canchones Pumping field, respectively (www.dga.cl). Data in 1993 (drilling period) is extracted from JICA (Citation1995). (d) Zoom of 1998–2002 time-period at J8. Ephemeral recharge events related to the 1999, 2000 and 2001 floods in the Quebrada de Chacarilla alluvial fan are reported by blue arrows. Associated values (in mm/year) are inferred from WTF method (Scanlon et al. Citation2002) with a specific yield of 0.08 [-] (Houston Citation2002). (e) Pumping changes at the Canchones (red line) and Carmelo (green line) pumping fields. Carmelo pumping field starts in 1999. Authorized groundwater extraction is fully described in Viguier et al. (Citation2019b), but are also available in Rojas (Citation2005), Rojas and Dassargues (Citation2007), Chávez et al. (Citation2016) and at the DGA data base (www.dga.cl).
![Figure 3. Hydrological and hydrogeological time series. (a) Oceanic Niño Index (http://origin.cpc.ncep.noaa.gov/products/analysis_monitoring/ensostuff/ONI_v5.php). Grey, red and blue curves display, neutral, El Niño and La Niña phases of the ENSO, respectively. (b) Monthly precipitation (mm) at Ujina meteorological station in the Andes (4300 m a.s.l.). Data is available at the DGA website (www.dga.cl). (c) Groundwater level time series (m a.s.l.) at J6 and J8, located at ~500 m and ~17 km from the Canchones Pumping field, respectively (www.dga.cl). Data in 1993 (drilling period) is extracted from JICA (Citation1995). (d) Zoom of 1998–2002 time-period at J8. Ephemeral recharge events related to the 1999, 2000 and 2001 floods in the Quebrada de Chacarilla alluvial fan are reported by blue arrows. Associated values (in mm/year) are inferred from WTF method (Scanlon et al. Citation2002) with a specific yield of 0.08 [-] (Houston Citation2002). (e) Pumping changes at the Canchones (red line) and Carmelo (green line) pumping fields. Carmelo pumping field starts in 1999. Authorized groundwater extraction is fully described in Viguier et al. (Citation2019b), but are also available in Rojas (Citation2005), Rojas and Dassargues (Citation2007), Chávez et al. (Citation2016) and at the DGA data base (www.dga.cl).](/cms/asset/1bd94d80-381a-401c-9eac-cc24a221b246/thsj_a_1764001_f0003_oc.jpg)
Figure 4. Modelling (and related error) of the pressure signal propagation in an idealized semi-infinite aquifer during the 1999–2005 time period, at J8, after the pumping interruption at the Canchones pumping field. J6 is the influential limit and it is used as proxy of the Canchones pumping field water table variations. At early times (1999–2001): ERMS = 0.04 and R2 = 0.97. T = 5.47 × 10⁻³ m2/s; S = 1.28 × 10⁻³ [-]. Observed deviation at intermediate and late times (ERMS = 0.65 and R2 = 0.96) results from the implementation of new withdrawals in the area, from 2001 onwards, which were not considered in this modelling exercise. Full blue line (J8) and dashed black line (J6) are polynomial trending curves (R2: 0.99) used for running the model at a suitable timestep. Further details are available in the manuscript (Section 3) and in the Appendix.
![Figure 4. Modelling (and related error) of the pressure signal propagation in an idealized semi-infinite aquifer during the 1999–2005 time period, at J8, after the pumping interruption at the Canchones pumping field. J6 is the influential limit and it is used as proxy of the Canchones pumping field water table variations. At early times (1999–2001): ERMS = 0.04 and R2 = 0.97. T = 5.47 × 10⁻³ m2/s; S = 1.28 × 10⁻³ [-]. Observed deviation at intermediate and late times (ERMS = 0.65 and R2 = 0.96) results from the implementation of new withdrawals in the area, from 2001 onwards, which were not considered in this modelling exercise. Full blue line (J8) and dashed black line (J6) are polynomial trending curves (R2: 0.99) used for running the model at a suitable timestep. Further details are available in the manuscript (Section 3) and in the Appendix.](/cms/asset/2b8e5eb2-cebe-4c04-be1d-6bfed2395f8a/thsj_a_1764001_f0004_oc.jpg)