Figures & data
Figure 1. Location of the study area indicating sampling points
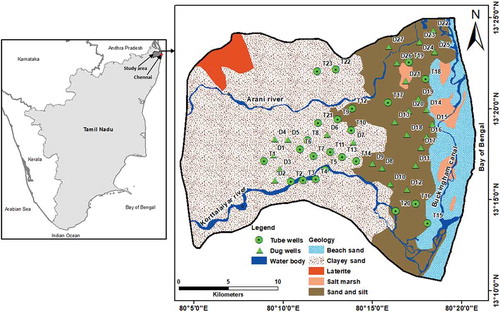
Figure 2. Spatial variation in electrical conductivity (EC) in the upper aquifer in (a) July 2014 and (b) December 2014, and in the lower aquifer in (c) July 2014 and (d) December 2014
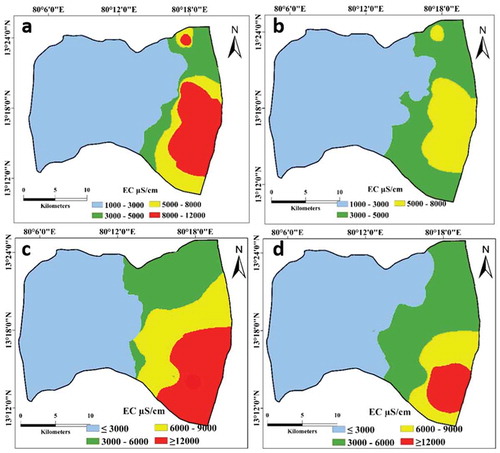
Figure 3. Temporal variation in the concentration of ions in the upper aquifer: (a) chloride and (b) sodium; and in the lower aquifer: (c) chloride and (d) sodium
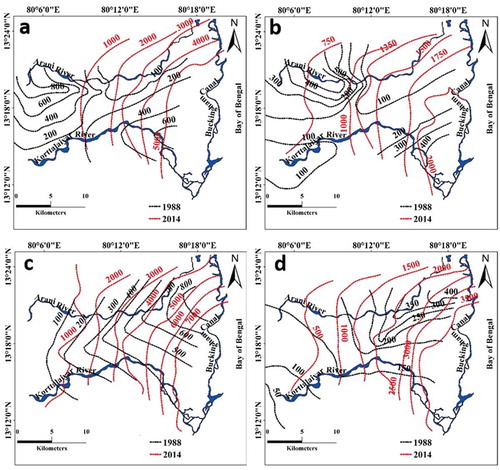
Figure 4. Plot of electrical conductivity vs. chloride showing normal groundwater conditions, saltwater intrusion and mixing for (a) July (pre-monsoon) and (b) December (post-monsoon)
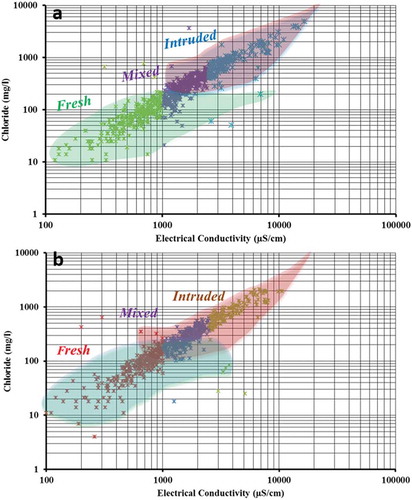
Figure 5. Hydrochemical facies evolution showing aquifer freshening and salinization in the upper aquifer in (a) July 2014 and (b) December 2014, and in the lower aquifer in (c) July 2014 and (d) December 2014
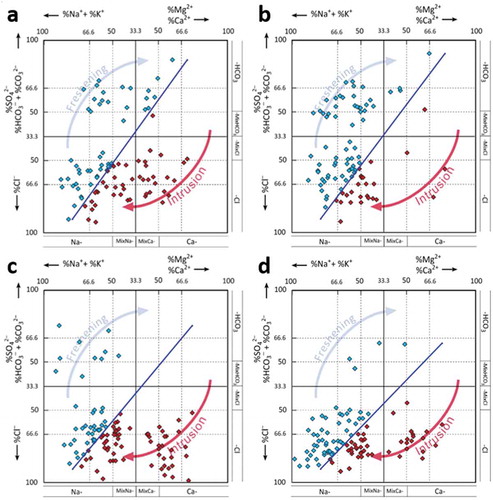
Table 1. Extent of seawater intrusion indicated by various indices in different time periods
Figure 6. Temporal variation in stable isotopes for (a) March and May 2012 and (b) July and December 2013, indicating the three groups of groundwater evolution: Group I – groundwater recharged by rainfall; Group II – mixed zone, i.e. mixture of rainfall derived from groundwater and seawater; and Group III – groundwater enriched due to seawater intrusion and evaporation. Canal: the Buckingham Canal; River: mouth of Arani River; GMWL: global meteoric water line; and IMWL: Indian meteoric water line
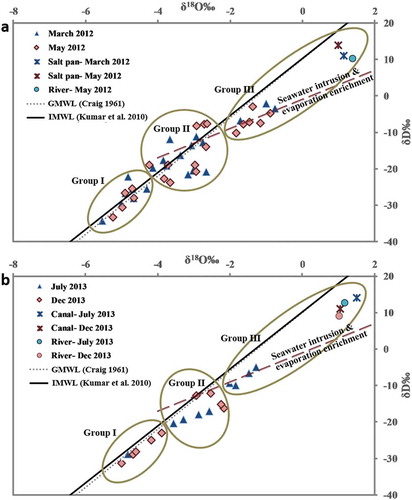
Table 2. Mineral phases and total dissolved solids (TDS) in the groundwater of the three zones. Zone 1: western part; Zone 2: northeast; Zone 3: southeast
Table 3. Physical and chemical characteristics of seawater and groundwater used in forward modelling. Chemical composition in mg/L
Figure 7. Simulated spatial variation in the concentration of major ions for (a) December 1969, (b) December 1987, (c) December 2007 and (d) December 2014. Simulated spatial variation in the concentration of (e) sodium and (f) chloride during different periods
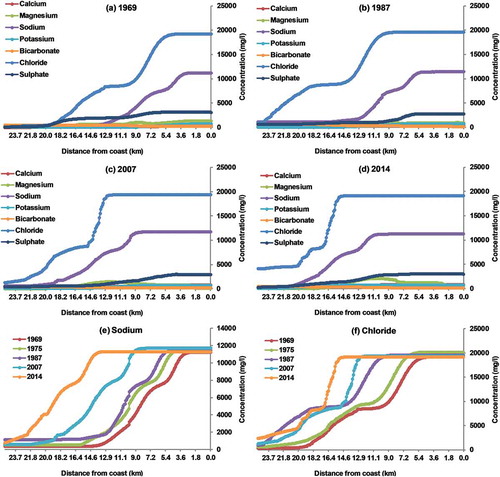
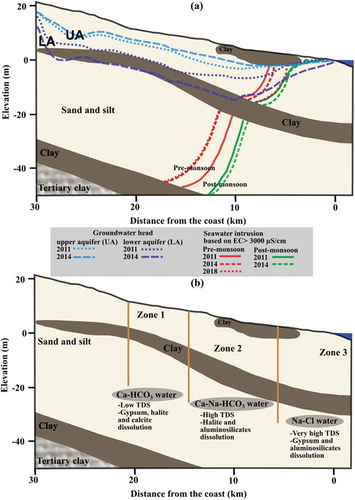
Figure 8. (a) Conceptual diagram of the seawater–freshwater interface showing the extent of seawater intrusion at different times. (b) Conceptual west-to-east cross section showing the identified geochemical processes