Figures & data
Figure 1. Locations of United States Department of Agriculture, Agricultural Research Service (USDA-ARS) experimental watersheds used to develop the relationships
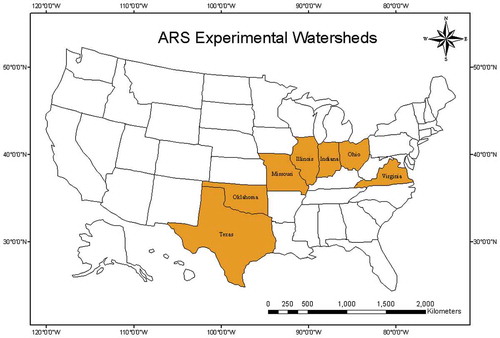
Figure 2. Location of ARS experimental watersheds used to validate the developed relationships
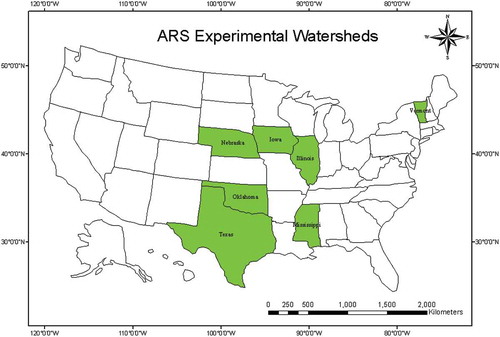
Figure 3. Scatterplots of CN derived from NEH-4 (CNT) versus CN derived from Verma et al. (CNV) for (a) linear, (b) exponential, (c) logarithmic, (d) power and (e) polynomial relationships
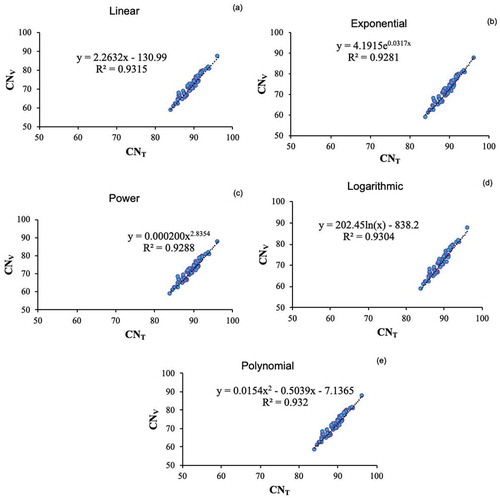
Figure 4. Coefficient of determination (R2)-based comparative performance of (a) tabular, (b) linear, (c) exponential, (d) power, (e) logarithmic and (f) polynomial models for watershed ID 44018. P: rainfall; Qc: computed runoff; Qo: observed runoff
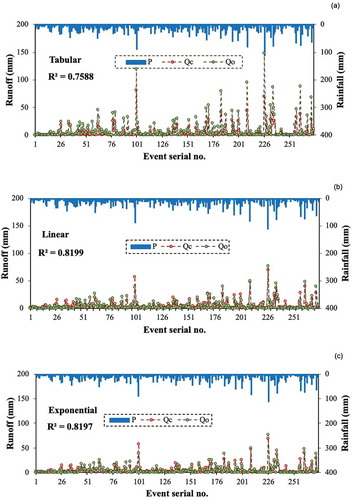
(Continued)
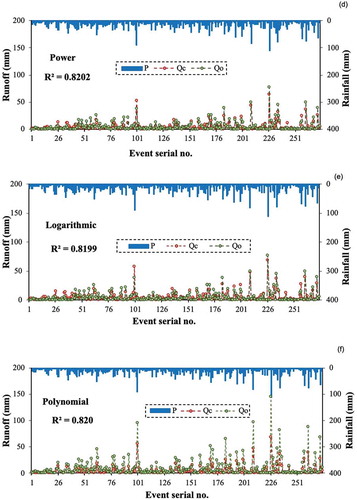
Table 1. Mathematical description of models under study. CN: curve number
Table 2. Model performance based on coefficient of determination (R2). Exp.: exponential; Log.: logarithmic; Poly.: polynomial
Figure 5. Box-and-whisker plot of Nash-Sutcliffe efficiency (NSE) of the models under study
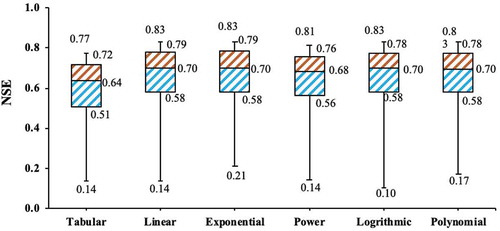
Table 3. Model performance based on Nash-Sutcliffe efficiency criterion (NSE). Exp.: exponential; Log.: logarithmic; Poly.: polynomial
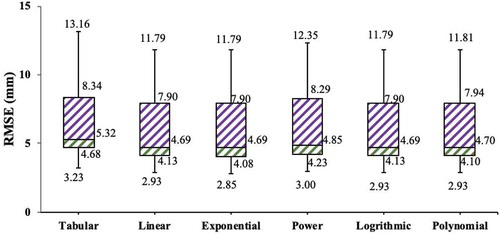
Figure 6. Box-and-whisker plot of root mean square error (RMSE) of the models under study