Figures & data
Table 1. Characteristics of the study sites
Figure 1. Schematic maps of the Lysina (LYS) and Neglinka (NEG) catchments, with location map of the studied sites in Europe. See insert location of the studied areas in the Czech Republic and in northwest Russia. For the LYS catchment, the location of the soil pits is shown. For the NEG catchment, the boundary of the catchment and the urban and settlement areas (diagonal pattern) is shown. NEG sampling sites: 1 – the upstream site; 2 – the downstream site; 3 – the Bezymjanny site (see text for details); the black star in the inset indicates the location of the studied area in northwest Russia
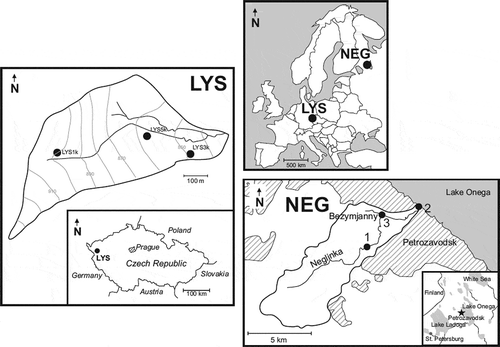
Table 2. Concentrations of Fe, Mn and Cr, and Cr isotope composition of the Lysina (LYS) catchment mineral soil and bedrock samples, and the Neglinka (NEG) catchment bedrock samples
Table 3. Hydrological features of LYS and NEG runoff, and meteorological conditions during sampling. Sampling sites: LYS: Lysina; NEG: Neglinka; UpS: upstream; DS: downstream; B: Bezymjanny creek. EC: electrical conductivity; T: Temperature; TH: total hardness; n.d.: not determined. All sampling was conducted between 10:00 and 11:00 h local time
Table 4. Chemical and isotopic features of LYS and NEG runoff. Sampling sites: LYS: Lysina; NEG: Neglinka; UpS: upstream; DS: downstream; B: Bezymjanny creek. n.d.: not determined. SD: standard deviation
Table 5. Correlation matrix of physico-chemical parameters, major ions and trace elements of Lysina (LYS) runoff. Bold formatting indicates correlation r > 50%. T: temperature; EC: electrical conductivity; Disch.: discharge; TH: total hardness; DOC: dissolved organic carbon
Table 6. Correlation matrix of physico-chemical parameters, major ions and trace elements of Neglinka (NEG) runoff. Bold formatting indicates correlation r > 50%. T: temperature; EC: electrical conductivity; Disch.: discharge; TH: total hardness; DOC: dissolved organic carbon
Figure 2. Distribution of δ53Cr values in Lysina (LYS) soil pits (see for soil pit locations)
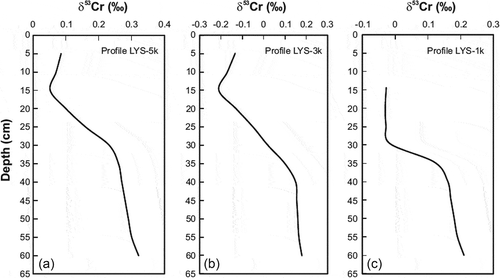
Figure 3. Fluctuation of the major ions and trace solute element concentration, pH and water hardness in runoff from the Lysina (LYS) and Neglinka (NEG) catchments. A star marks data on the Bezymjanny tributary. Sampling was conducted at intervals of about 1 month at either the very beginning or the very end of each consecutive month. The collecting months on the diagram are those immediately preceding the collecting date: for example, if the sampling date was 1 March, the sampling month is considered the previous February on the diagram; if the sampling date was 29 June, the sampling month is considered June on the diagram. Snowmelt periods are marked as the months when actual snowmelt occurred
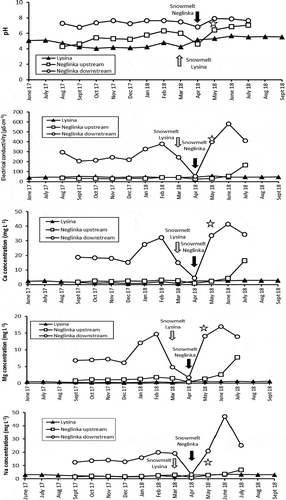
Figure 3. (Continued)
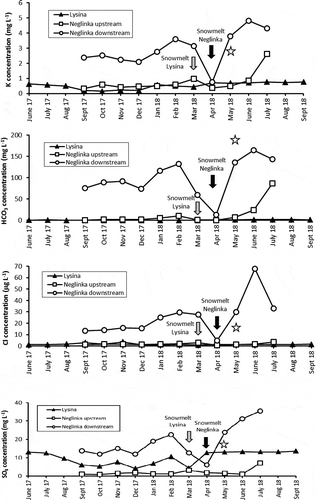
Figure 3. (Continued)
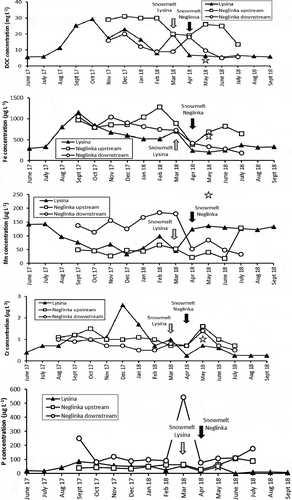
Figure 4. Piper diagram showing the water types in runoff from the Lysina (LYS) and Neglinka (NEG) catchments
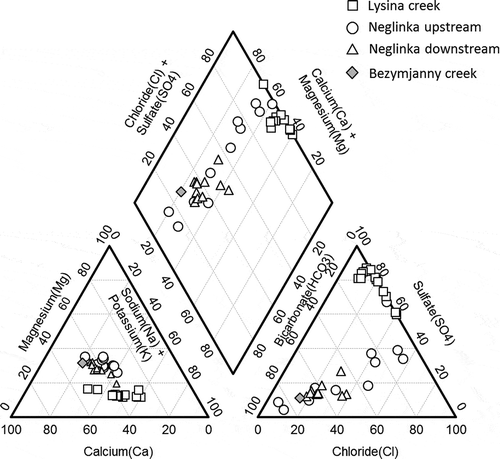
Figure 5. Runoff time series of δ53Cr values for the Lysina (LYS) and Neglinka (NEG) catchments. See explanation of sampling periods in (caption)
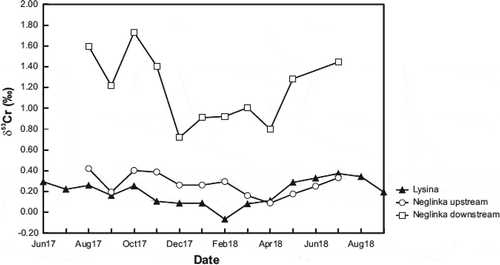
Figure 6. Decrease in δ53Cr plotted against fraction of remaining Cr (III) after oxidation of Cr (III) to Cr (VI) in the Lysina (LYS) soil. See text for details
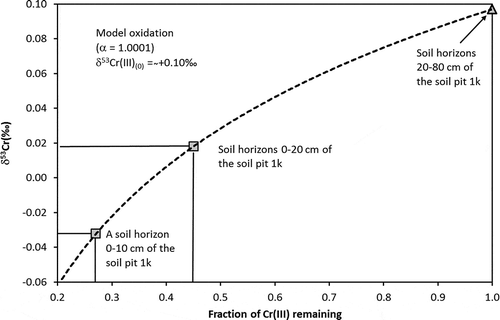
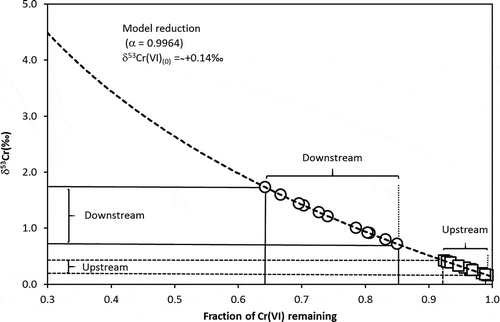
Figure 7. Concomitant increase in δ53Cr plotted against the remaining fraction of Cr (VI) during reduction in the Neglinka (NEG) runoff. The range of δ53Cr values for upstream runoff is shown as empty squares; that for downstream runoff is shown as empty circles. See text for details