
Figures & data
Figure 1. The study area, Lake Malawi and Shire River basins
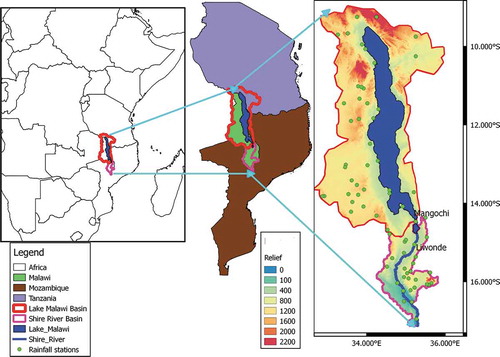
Figure 2. Mean annual rainfall pattern and monthly mean rainfall in Lake Malawi and Shire River basins
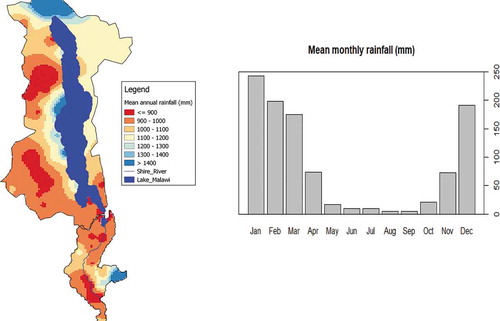
Figure 3. Lake level and lake outflow. Statistical parameters are from 1970 to 2013 for lake level and from 1976 to 2009 for outflow. The red line is the flow required for maximum hydropower generation
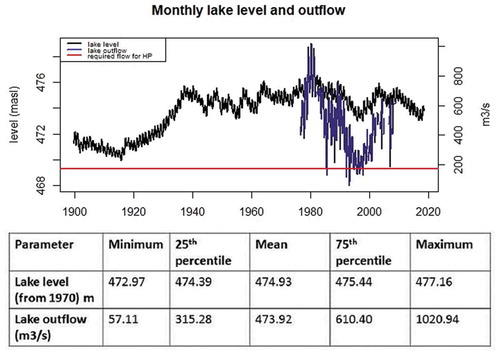
Table 1. Modified standardised precipitation index (SPI) classification. Information source: World Meteorological Organization (Citation2012). (Standardised precipitation and evaporation index (SPEI) and lake level change index (LLCI))
Table 2. Mann-Kendall (MK) test (tau) and Sen’s slope results for precipitation, temperature and lake level at the regional scale. Only Sen’s slopes of significant MK test trends are presented
Figure 4. Mann-Kendall (MK) test results from 1970 to 2013 in Lake Malawi and Shire River basins for rainfall (left) and temperature (right). The significance of the trends is based on p < 0.05
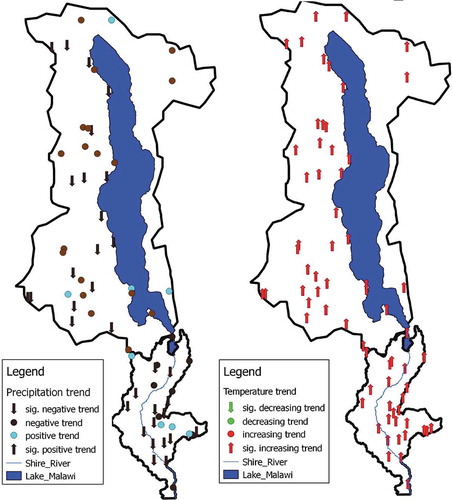
Table 3. Meteorological drought events in Lake Malawi and Shire River Basins between 1970 and 2013 as detected by standardised precipitation and evaporation index and standardised precipitation index at 12-month scale (SPEI12 and SPI12)
Figure 5. Standardised precipitation and evaporation index and standardised precipitation index at 12-month scale (SPEI12 and SPI12) series for Lake Malawi and Shire River basins from 1970 to 2013. Numbers represent drought events
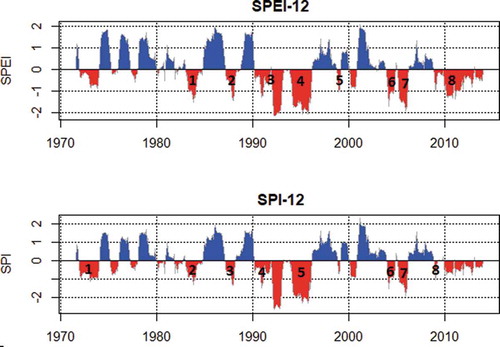
Table 4. Comparison of mean spatial standardised precipitation index and -standardised precipitation and evaporation index at 12 month scale (SPI12 and SPEI12) in terms of the mean drought severity, intensity, duration and frequency and the percentage of total drought months, using t-test
Figure 6. Mean drought parameters generated from the standardized precipitation and evaporation index (SPEI) and the standardized precipitation index (SPI) in Lake Malawi basin (LMB) and Shire River basin (SRB) for the period 1970–2013. The parameters from left to right are severity, intensity, duration, frequency and percentage of total drought months
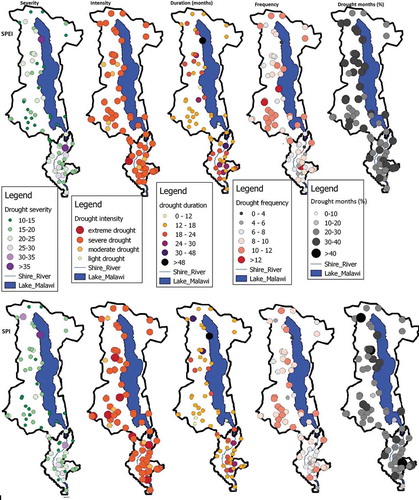
Figure 7. Hydrological and meteorological droughts in Lake Malawi basin from 1970 to 2013. Numbers represent drought events. (a) Lake level change index (LLCI) is based on 12-month scale. Meteorological droughts are based on standardised precipitation and evaporation index at (b) 12-month scale (SPEI12), (c) 24-month scale (SPEI24) and (d) 36-month scale (SPEI36)
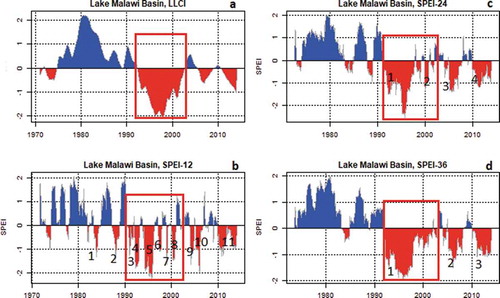
Figure 8. Comparison of hydrological drought based on lake level change index at 12-month scale (LLCI12) and meteorological droughts based on standardised precipitation and evaporation index at (a) 12-month scale (SPEI12), (b) 24-month scale (SPEI24), (c) 36-month scale (SPEI36) in Lake Malawi basin only. (d) The relationship between SPEI36 and LLCI12t10 (10-month lag). Vertical and horizontal yellow lines mark drought threshold
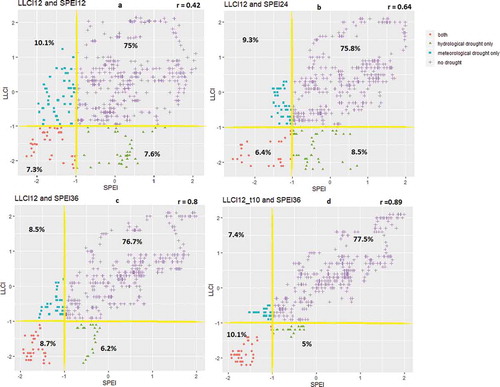
Figure 9. Comparison of standardised precipitation and evaporation index at 36-month scale (SPEI36), lake level change index at 12-month scale (LLCI12) and LLCI12 at 10-month lag
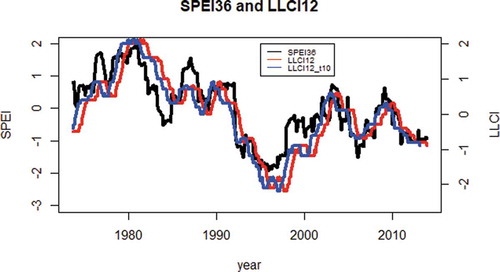
Figure 10. Meteorological drought trends in Lake Malawi and Shire River basins for the standardized precipitation and evaporation index (SPEI) and the standardized precipitation index (SPI). The significance of the trends is based on p < 0.05. The decreasing trend implies increase in drought
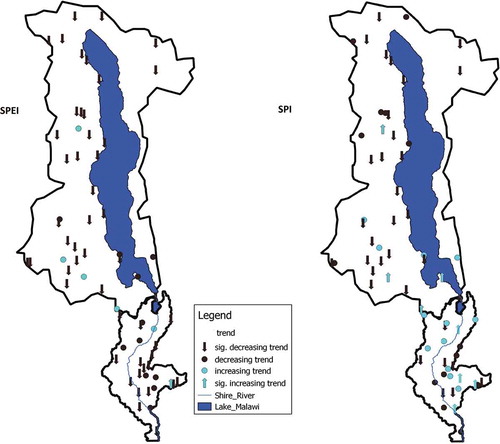
Table 5. Mann-Kendall (tau) and Sen’s slope results for meteorological and hydrological drought parameters. A negative trend for drought intensity signifies an increasing trend of drought. Only Sen’s slopes for parameters with significant trends are presented