
Figures & data
Figure 1. Number of stations having less than 5% missing data each year (left) and catchment sizes (right)
Figure 2. Mean annual percentage of zero-flow days for hydrological years
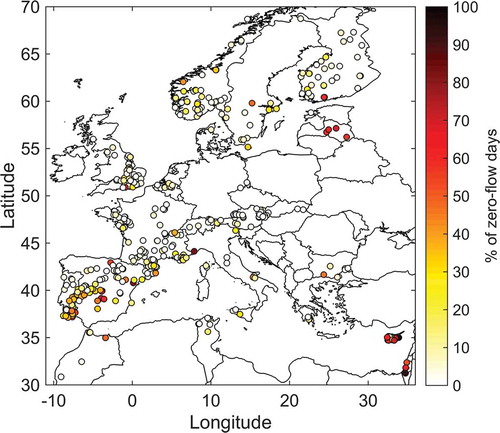
Figure 3. Cluster analysis of zero-flow seasonality. Colours represent seasonality of zero-flow events classified in three clusters (winter, summer and autumn)
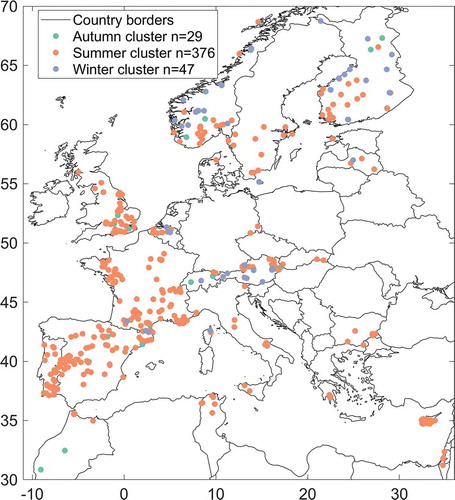
Figure 4. Flow regime (left) and mean occurrence of zero-flow days (right) for the three clusters identified in
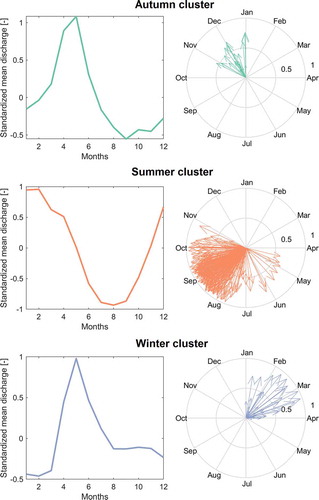
Figure 5. Significant increasing (later date) or decreasing (earlier date) trends in the mean date of zero-flow day occurrence, at the 10% significance level
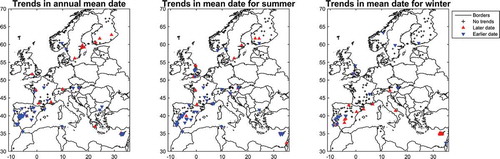
Table 1. Summary of the detected trends in the annual and seasonal number of zero-flow days and the maximum length of dry spells
Figure 6. Increasing (upward triangle) or decreasing (downward triangle) trends, at the 10% significance level, for the annual or seasonal mean number of zero-flow days (left), and the annual or seasonal maximum length of dry spells (right). On average, for all indicators and seasons, 28% of stations have significant trends
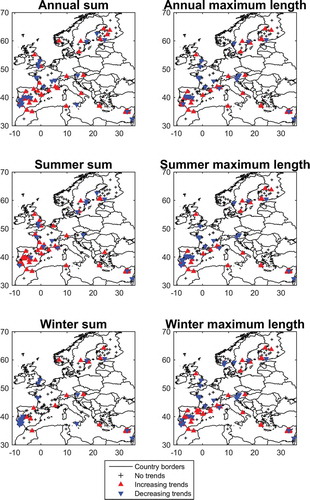
Figure 7. Scatter plot of the relationship between the Sen slope of trends in the annual number of zero-flow days and the annual maximum duration of zero-flow periods
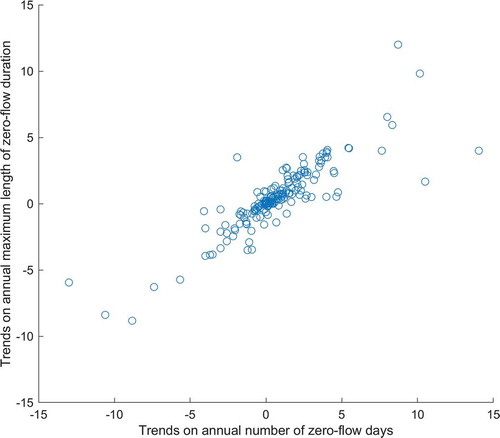
Figure 8. Significant correlations at the 5% level between annual, summer and winter sum of zero-flow days, and the maximum length of dry periods with SPEI over the different basins for different aggregation periods of 6, 12, 18 and 24 months (Standardized Precipitation Evapotranspiration Index) (SPEI6, SPEI12, SPEI18 and SPEI24, respectively)
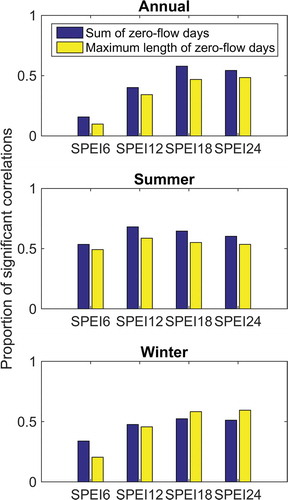
Figure 9. Map of the significant correlations between the annual sum of zero-flow days (top) and the annual maximum length of zero-flow days (bottom) with the (Standardized Precipitation Evapotranspiration Index) SPEI18. Crosses indicate stations where the correlation is not significant at the 10% level. Correlations are negative because the smaller the SPEI (water deficit), the larger the number of zero-flow days
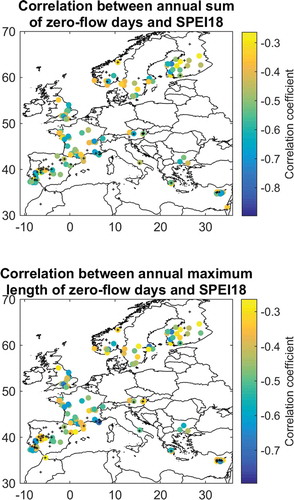
Table 2. Summary of catchments with significant correlations () between seasonal metrics of intermittence and large-scale climate drivers. Subscripts
DJF, JJA, w1 refer to the summer (April–September), winter (September–March), December–February, June–August, and winter from the preceding year, respectively
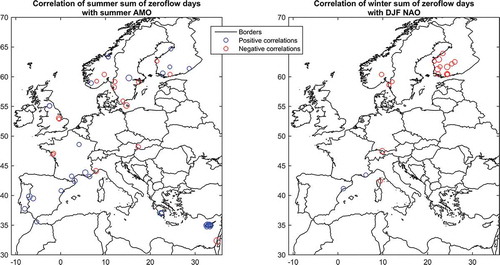
Figure 10. Significant correlations between summer zero-flow days and Atlantic Multi-decadal Oscillation (AMO) (left) and between winter zero-flow days and North Atlantic Oscillation (NAO) (right)
Data availability statement
The indices computed in the present work will be made available to the community for research applications upon request to the first author.