Figures & data
Figure 1. Joint distribution plot of annual runoff in the Baihe and Chaohe rivers in four periods between 1963 and 2011, proving that runoff–runoff stationarity will be compromised into non-stationarity if affected by human disturbances. Period 1: 1963–1973, the baseline period; Period 2: 1974–1982, the low-impact period fairly close to the baseline; Period 3: 1983–1997, the altered period proven to be dramatically affected by human activities; and Period 4: 1998–2011, the altered period proven to be affected by cumulative human activities (Wang et al., 2015)
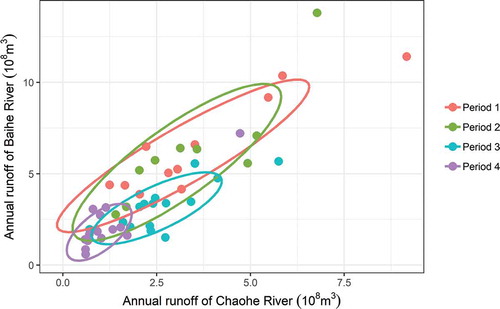
Figure 2. The probabilistic conceptual model, Assessment Model of Human Impact on Runoff Based on Stationarity Hypothesis (AMHIRBSH), to separate the impacts of human activities from those of climate change on runoff variations: (a) example of the runoff–runoff relationship (expressed by the joint distribution) having changed from D1 to D2, affected by human activities; and (b) example of the conditional probability density function of R2 given R1 = r1.
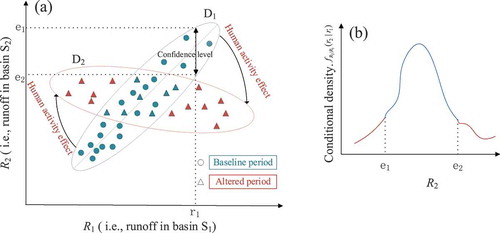
Figure 3. Framework for attributing human activities to runoff variations by using the probabilistic conceptual model
Figure 4. Location of the Baiyangdian drainage basin, North China
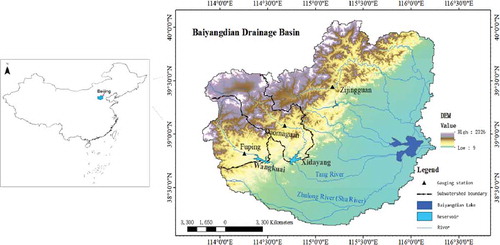
Table 1. Pettitt test results and mean of runoff series in the baseline and altered periods
Figure 5. Trends (1960–2002) of annual runoff in typical hydrologic gauging stations in the Baiyangdian drainage basin. The grey band shows the 95% confidence interval of the LOESS smoothing (in R software) for runoff
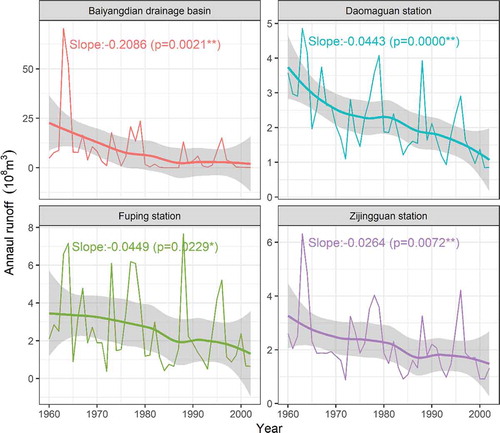
Table 2. Goodness-of-fit tests for the marginal distributions of runoff pairs. The underlined values are the best distributions of runoff in the specified site. AIC: Akaike information criterion; D: Kolmogorov’s goodness-of-fit statistic
Table 3. Goodness-of-fit tests for joint probability distributions of the runoff pairs. AIC: Akaike information criterion; Sn: von Cramér’s goodness-of-fit statistic
Figure 6. Joint probability distributions for annual runoff in the Wangkuai sub-watershed and the Xidayang sub-watershed. (a) and (b) are the cumulative probability distributions; (c) and (d) are the probability densities of distributions
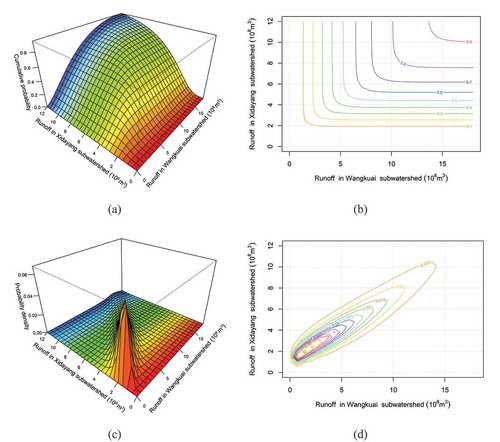
Figure 7. Scatter plots and violin plots of the conditional densities of XR (annual runoff in Xidayang sub-watershed) given WR (annual runoff in Wangkuai sub-watershed) in the baseline and altered periods. The two layers are: (i) mapped points (scatter plot) of the conditional densities of XR given WR (i.e. ), and (ii) the compact display (violin plot) of the entire distribution of
the median, interquartile range and lower/upper adjacent values are also given
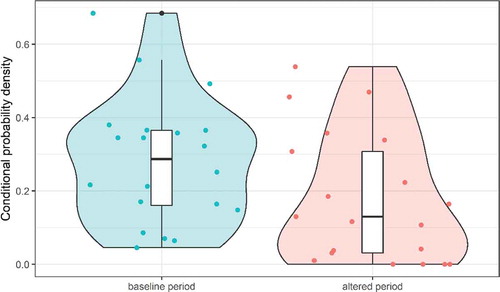
Figure 8. Double mass curve (DMC) of annual precipitation and runoff for the period 1960–2002 in (a) Wangkuai sub-watershed and (b) Xidayang sub-watershed, showing the linear regression of cumulative precipitation and runoff in the baseline period (blue) and altered period (orange)
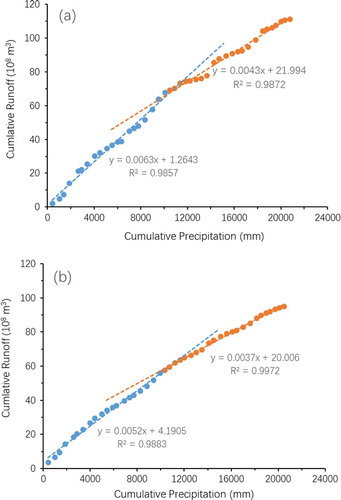
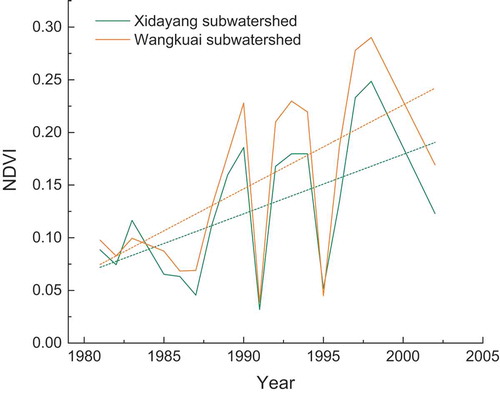
Figure 9. Variations of the normalized difference vegetation index (NDVI) in the Xidayang and Wangkuai sub-watersheds