Figures & data
Figure 1. Location of the proposed project in Iran
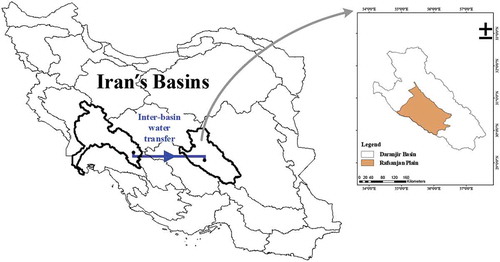
Figure 2. The framework of the socio-hydrological agent-based model (ABM)
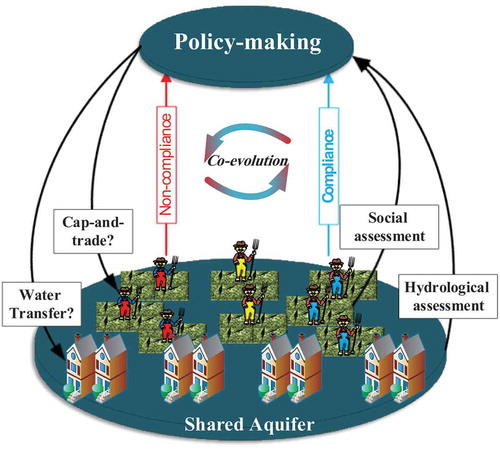
Figure 3. Flowchart of the agent-based cap-and-trade market
Figure 4. Outcomes of the water transfer (WT) project and the cap-and-trade policy (C&T): time series of (a) unit hydrograph of Rafsanjan Aquifer, (b) changes in farmers’ profit (net benefit), (c) social norm, (d) water price, (e) cumulative farmers’ surplus, and (f) volume of traded water. The intervals show 95% confidence bands
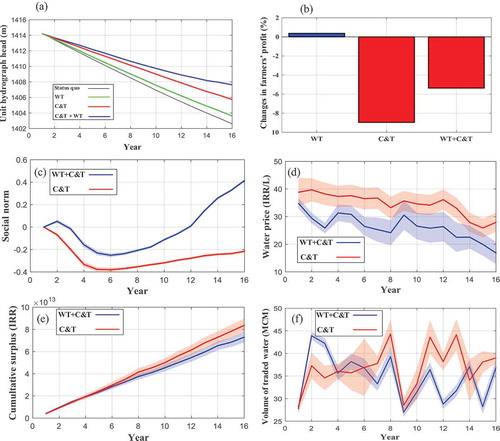
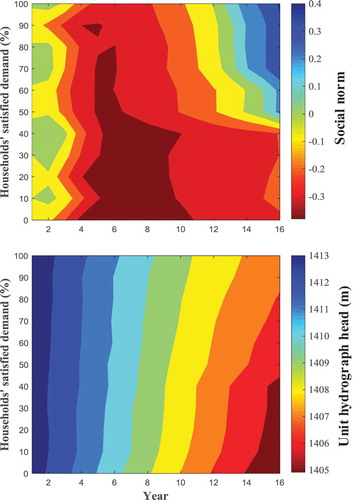
Figure 5. Sensitivity analysis results: time series of (a) social norms and (b) unit hydrograph heads when different amounts of households’ demands are satisfied by the water transfer project (for different conveyance capacities)