Figures & data
Table 1. Summary of storage equations (special cases of the proposed general storage Equation (11))
Table 2. Observed hydrographs and estimated outflow hydrographs using different Muskingum models for example 1 (smooth single-peak inflow and outflow hydrographs)
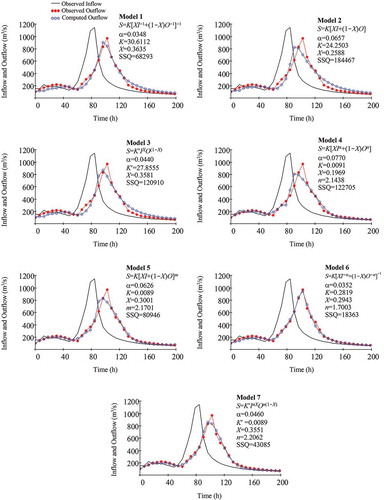
Figure 1. Observed and estimated hydrographs for example 1 (smooth single-peak hydrograph) along with estimated optimal parameters for different Muskingum models using the SSQ index (the sum of the squared deviations between observed and computed outflows) as an objective function
Table 3. Observed hydrographs and estimated outflow hydrographs using different Muskingum models for example 2 (non-smooth single-peak inflow and outflow hydrographs)
Figure 2. Observed and estimated hydrographs for example 2 (non-smooth single-peak hydrograph) along with estimated optimal parameters for different Muskingum models using the SSQ index (the sum of the squared deviations between observed and computed outflows) as an objective function
Table 4. Observed hydrographs and estimated outflow hydrographs using different Muskingum models for example 3 (multiple-peak inflow and outflow hydrographs)
Figure 3. Observed and estimated hydrographs for example 3 (double-peak hydrograph) along with estimated optimal parameters for different Muskingum models using the SSQ index (the sum of the squared deviations between observed and computed outflows) as an objective function
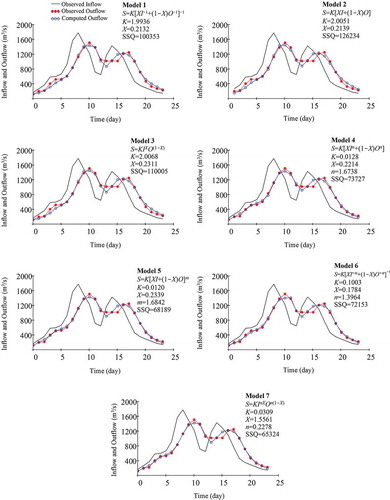
Table 5. Observed hydrographs and estimated outflow hydrographs using different Muskingum models for example 2 by incorporating the lateral inflow r = 1.202 (Non-smooth Single-peak inflow and outflow hydrographs)
Figure 4. Observed and estimated hydrographs for example 2 considering inflow effects (non-smooth single-peak hydrograph) along with estimated optimal parameters for different Muskingum models using the SSQ index (the sum of the squared deviations between observed and computed outflows) as an objective function